David Eby and his globalist cronies began forcefully imposing their New Normal™ on western countries in 2020.
Mortality data from British Columbia, Canada indicate that 2015 was actually the year the cult of death began introducing us to their New Normal™ death rates.
Deaths From Unknown Causes are the defining feature of the New Normal™
Deaths – Unknown Causes – Male – Aged 55-59 | British Columbia, Canada
Populalation – Male – Aged 55-59 – [2001-2022] | British Columbia, Canada
“Of course deaths are going up, we have an aging population.“
That’s why we look at 5-year age groups.
The main thing about men aged 55-59, is that although they’re not always the same people, they ARE always aged 55-59.
“Yeah, but the population is growing. That’s why there are more deaths.“
Maybe it is, and maybe it isn’t; which is why we should focus on death RATES.
How many men aged 55-59 were there?
How many of them died from Unknown Causes?
100% control for population growth.
Deaths/100,000 male 55-59 from Unknown Causes
There is no argument that we have an aging population, or that as population increases, so do deaths.
But what if the increased deaths aren’t among the elderly?
What if it’s younger people who have been dying at ever-increasing rates since 2015 while the elderly are dying at similar, or even lower rates than the did prior to 2015?
Thanks to the New Normal™, brought to you by cult-of-death members like David Eby and his globalist buddies, this is exactly what we are seeing.
That’s why it’s important to use actual government data, look at it in 5-year age brackets, and compare death rates before the UN’s 2015 adoption of The 2030 Agenda For Sustainable Development, to the death rates following it’s adoption.
When we do this, we find that everything David Eby and his globalist buddies have been telling us is untrue.
The truth is, old folks and young children – those they claimed in 2020 to have been shutting down our societies for, are the least affected groups.
While it was the “plandemic” which brought the phenomenon of excess deaths into public awareness, the deadly trend itself started in 2015, with young men and women aged 20-45 being it’s main victims and Deaths From Unknown Causes being its leading cause.
Check out UN “Sustainable” Development Goal SDG3 – “Ensure healthy lives and promote well-being for all at all ages”
Then, browse through the tabs for all at all ages below the following graphic and decide for yourself:
Is this health and well being?
Is this “sustainable”?
Is this even tolerable?
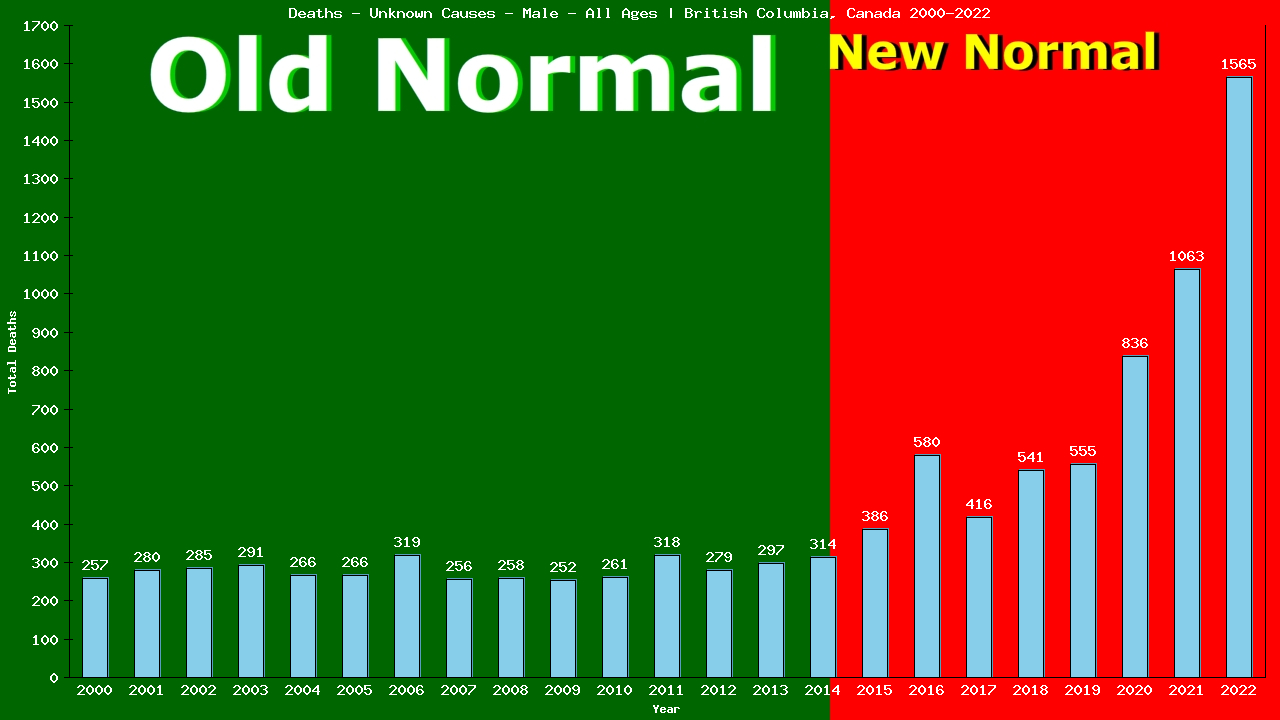
1,565 of the 24,226 deaths among men of all ages living in British Columbia in 2022 were from Unknown Causes (6.46% of all deaths).
This is up 323% compared to Old Normal (2001-2014) rates which, when applied to the this year's male population of 2,628,580 men would have predicted 343 deaths from Unknown Causes.
This means there were 1,222 more deaths than expected from Unknown Causes among men of all ages living in British Columbia in 2022.
To date, 3,334 male lives have been lost to Unknown Causes over the first 8 years of British Columbia's New Normal™.
Browse through the age categories below to learn how these deaths from Unknown Causes in 2022 are distributed among each age group of males in British Columbia.
Click the bar graph above to see how both the 2022 loss of 1,222 lives and the 8-year loss of 3,334 male lives from Unknown Causes is arrived at.
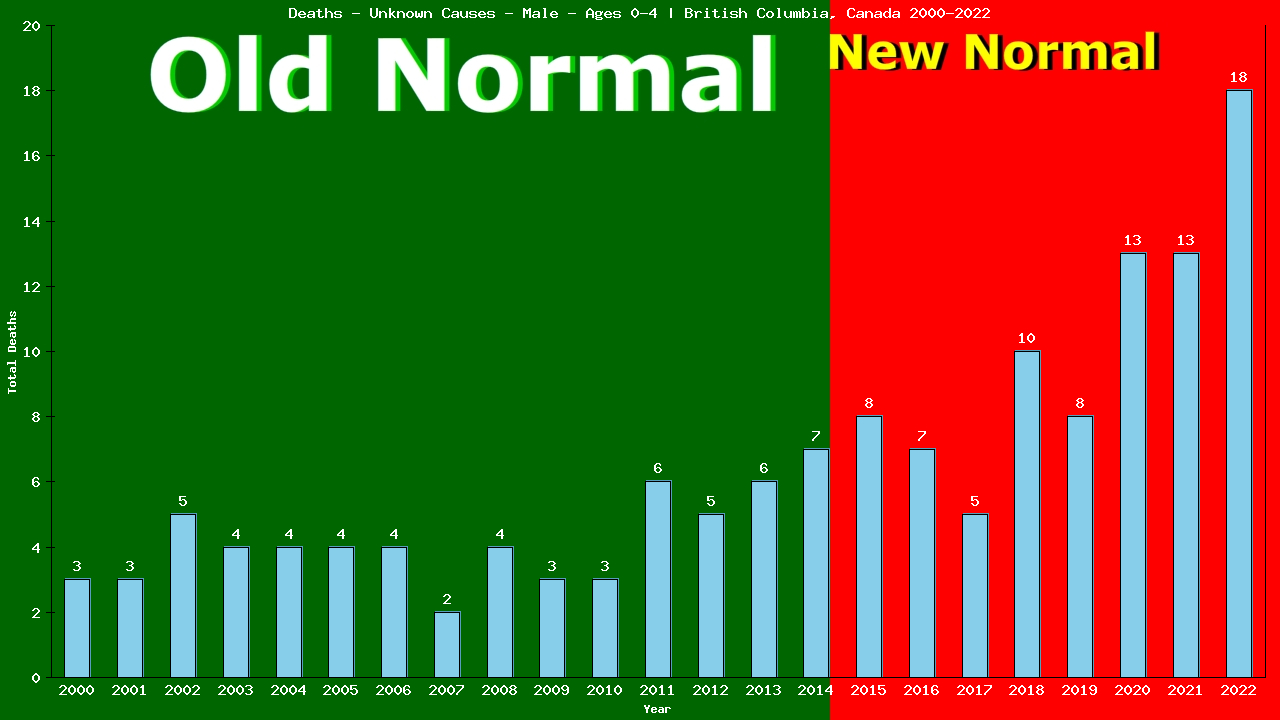
The first 18 of the 1,565 deaths from Unknown Causes in 2022 were among pre-school boys aged 0-4, accounting for 17.31% of the 104 total deaths in this group.
This is up 221% compared to Old Normal rates which, when applied to this year's population of 114,904 pre-school boys aged 0-4, would have predicted 4 deaths from Unknown Causes this year.
This means there were 14 more deaths than expected from Unknown Causes among pre-school boys aged 0-4 living in British Columbia in 2022.
Overall, 82 deaths from Unknown Causes represent 46 lives lost among pre-school boys aged 0-4 over the first 8 years of British Columbia's New Normal™.
Click the bar graph above to see how both the 2022 total of 14 more live lost than expected and the 8 year total of 82 lives lost from Unknown Causes among pre-school boys aged 0-4 is arrived at.
Yearly Unknown Causes Tally: 18 / 1,565
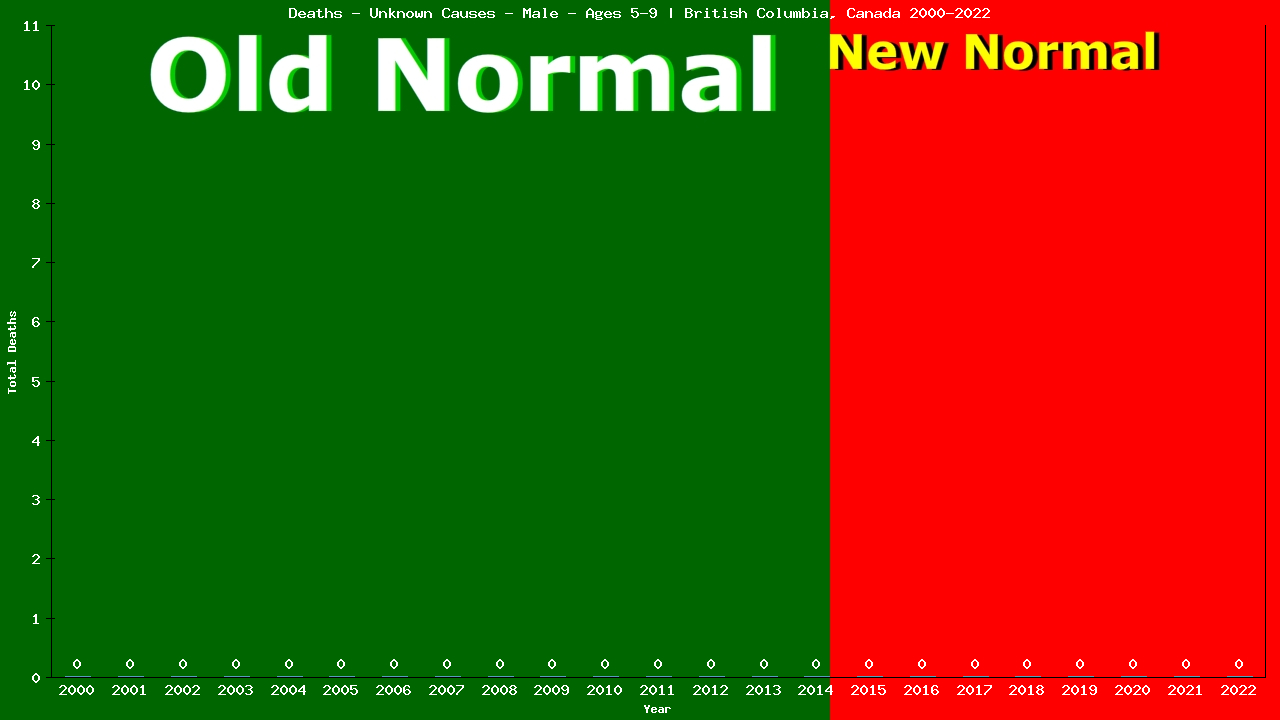
The next 0 of the 1,565 male deaths from Unknown Causes in 2022 were among boys aged 5-9, accounting for 0.00% of the 8 total deaths in this group.
This is down 100% compared to Old Normal rates. Those rates, applied to this year's population of 129,781 boys aged 5-9, would have predicted 0 deaths from Unknown Causes this year.
This means there were 0 fewer deaths than expected from Unknown Causes among boys aged 5-9 living in British Columbia in 2022.
Overall, 0 deaths from Unknown Causes represent 0 lives saved among boys aged 5-9 over the first 8 years of British Columbia's New Normal™.
Click the bar graph above to see how the both the 2022 total of 0 fewer and the 8 year total of 0 fewer male aged 5-9 deaths from Unknown Causes is arrived at.
Yearly Unknown Causes Tally: 18 / 1,565

The next 0 of the 1,565 male deaths from Unknown Causes in 2022 were among boys aged 10-14, accounting for 0.00% of the 17 total deaths in this group.
This is down 100% compared to Old Normal rates. Those rates, applied to this year's population of 131,525 boys aged 10-14, would have predicted 0 deaths from Unknown Causes this year.
This means there were 0 fewer deaths than expected from Unknown Causes among boys aged 10-14 living in British Columbia in 2022.
Overall, 0 deaths from Unknown Causes represent 0 lives saved among boys aged 10-14 over the first 8 years of British Columbia's New Normal™.
Click the bar graph above to see how the both the 2022 total of 0 fewer and the 8 year total of 0 fewer male aged 10-14 deaths from Unknown Causes is arrived at.
Yearly Unknown Causes Tally: 18 / 1,565
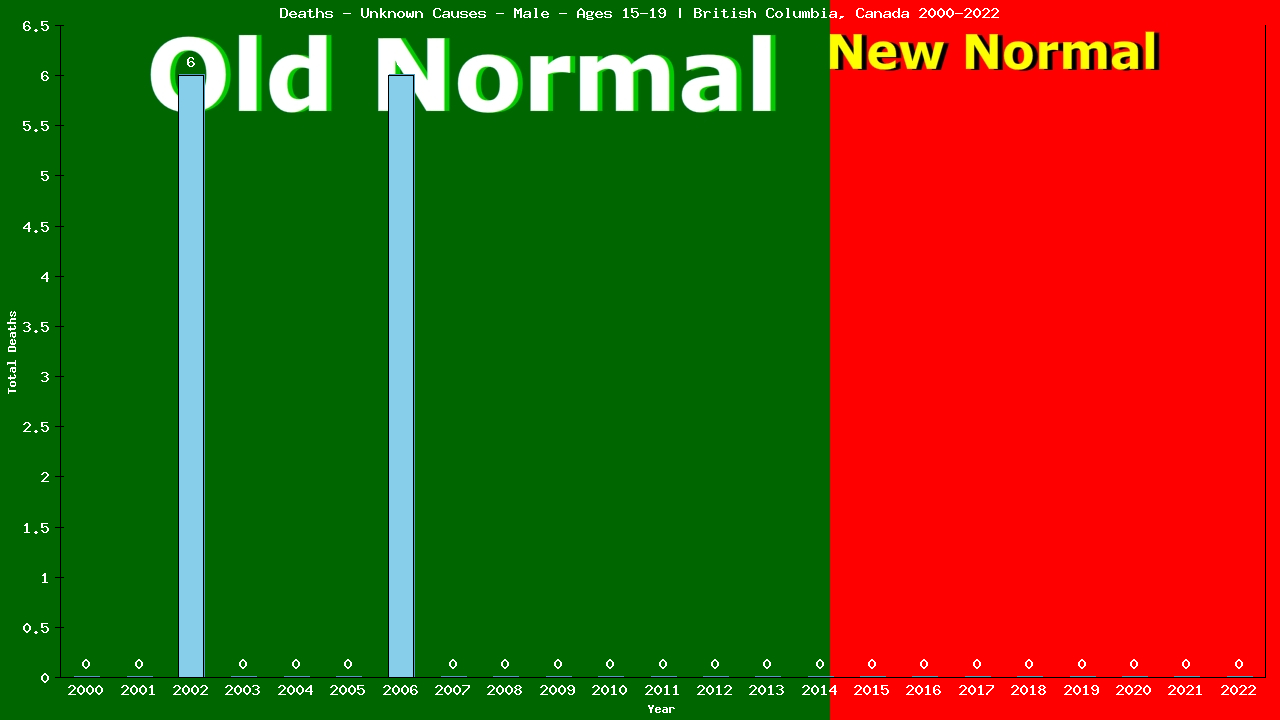
The next 0 of the 1,565 male deaths from Unknown Causes in 2022 were among teen-aged boys aged 15-19, accounting for 0.00% of the 81 total deaths in this group.
This is down 100% compared to Old Normal rates. Those rates, applied to this year's population of 138,050 teen-aged boys aged 15-19, would have predicted 1 deaths from Unknown Causes this year.
This means there were 1 fewer deaths than expected from Unknown Causes among teen-aged boys aged 15-19 living in British Columbia in 2022.
Overall, 0 deaths from Unknown Causes represent 7 lives saved among teen-aged boys aged 15-19 over the first 8 years of British Columbia's New Normal™.
Click the bar graph above to see how the both the 2022 total of 1 fewer and the 8 year total of 0 fewer male aged 15-19 deaths from Unknown Causes is arrived at.
Yearly Unknown Causes Tally: 18 / 1,565
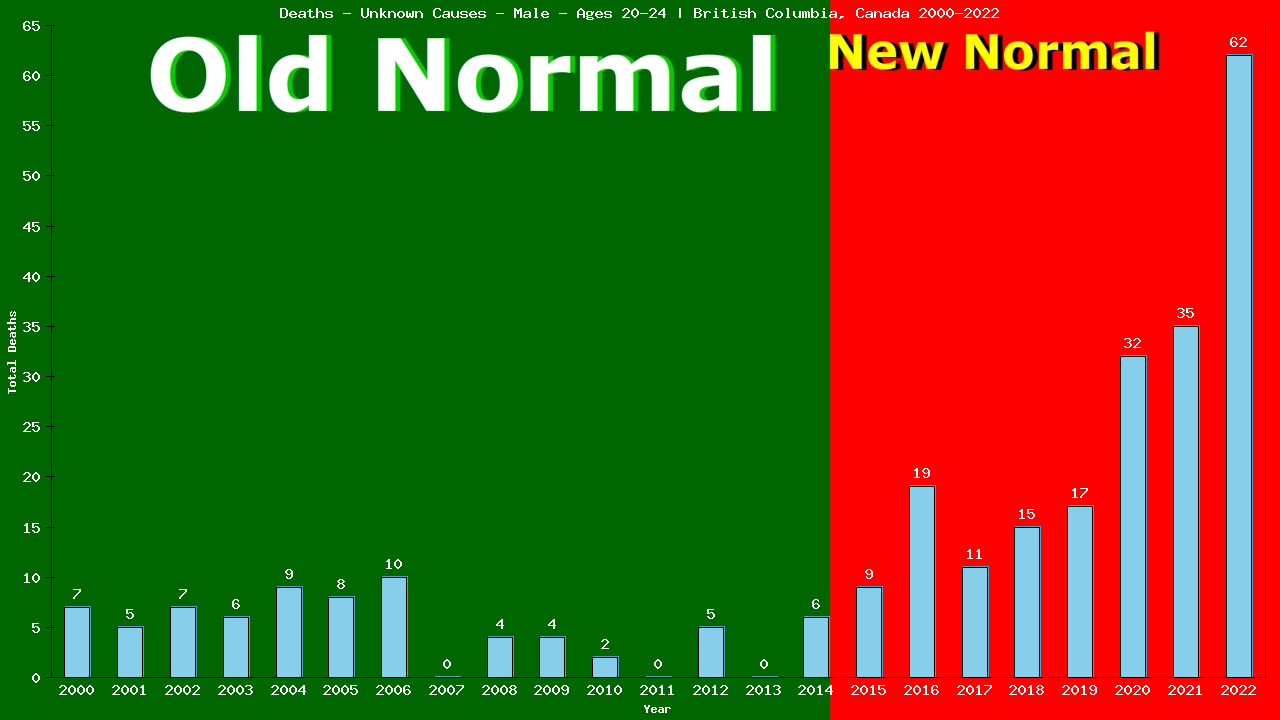
The next 62 of the 1,565 male deaths from Unknown Causes in 2022 were among men aged 20-24, accounting for 33.51% of the 185 total deaths in this group.
This is up 750% compared to Old Normal rates. Those rates, applied to this year's population of 176,835 men aged 20-24, would have predicted 6 deaths from Unknown Causes this year.
This means there were 56 more deaths than expected from Unknown Causes among men aged 20-24 living in British Columbia in 2022.
Overall, 200 deaths from Unknown Causes represent 157 lives lost among men aged 20-24 over the first 8 years of British Columbia's New Normal™.
Click the bar graph above to see how the both the 2022 total of 56 more and the 8 year total of 200 more male aged 20-24 deaths from Unknown Causes is arrived at.
Yearly Unknown Causes Tally: 80 / 1,565
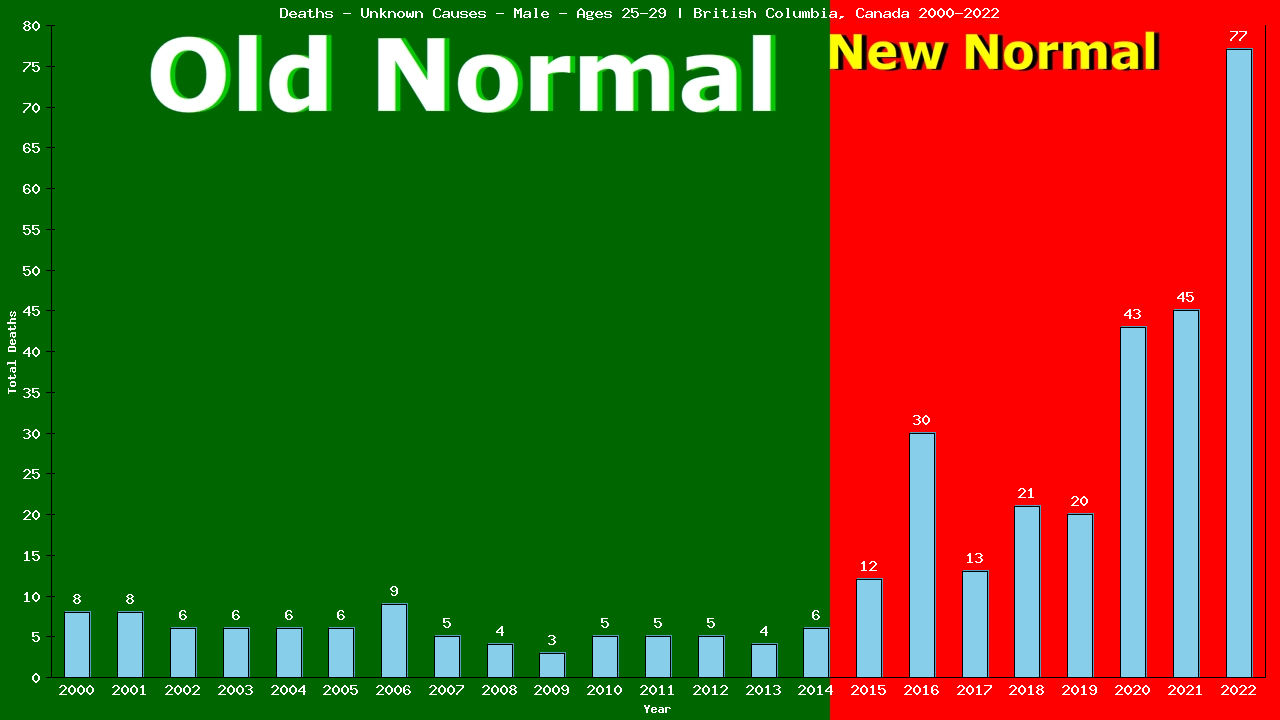
The next 77 of the 1,565 male deaths from Unknown Causes in 2022 were among men aged 25-29, accounting for 30.55% of the 252 total deaths in this group.
This is up 730% compared to Old Normal rates. Those rates, applied to this year's population of 192,867 men aged 25-29, would have predicted 7 deaths from Unknown Causes this year.
This means there were 70 more deaths than expected from Unknown Causes among men aged 25-29 living in British Columbia in 2022.
Overall, 261 deaths from Unknown Causes represent 206 lives lost among men aged 25-29 over the first 8 years of British Columbia's New Normal™.
Click the bar graph above to see how the both the 2022 total of 70 more and the 8 year total of 261 more male aged 25-29 deaths from Unknown Causes is arrived at.
Yearly Unknown Causes Tally: 157 / 1,565
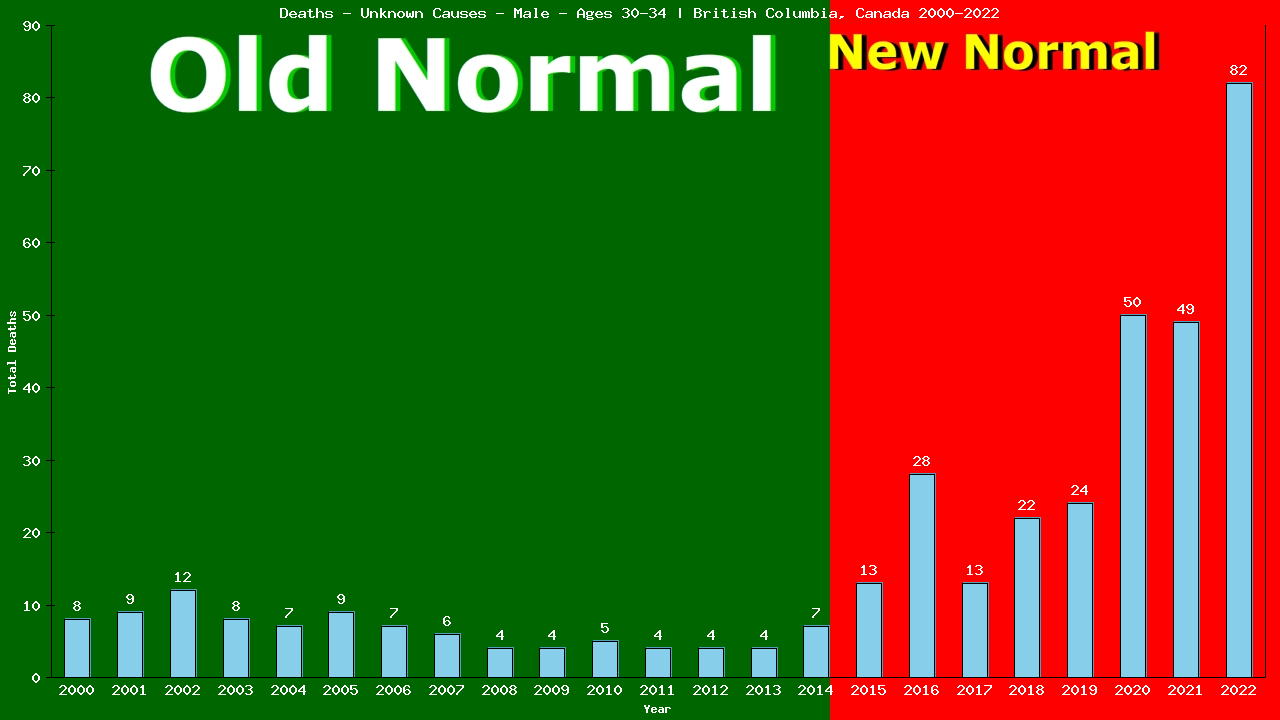
The next 82 of the 1,565 male deaths from Unknown Causes in 2022 were among men aged 30-34, accounting for 28.67% of the 286 total deaths in this group.
This is up 650% compared to Old Normal rates. Those rates, applied to this year's population of 202,831 men aged 30-34, would have predicted 9 deaths from Unknown Causes this year.
This means there were 73 more deaths than expected from Unknown Causes among men aged 30-34 living in British Columbia in 2022.
Overall, 281 deaths from Unknown Causes represent 216 lives lost among men aged 30-34 over the first 8 years of British Columbia's New Normal™.
Click the bar graph above to see how the both the 2022 total of 73 more and the 8 year total of 281 more male aged 30-34 deaths from Unknown Causes is arrived at.
Yearly Unknown Causes Tally: 239 / 1,565
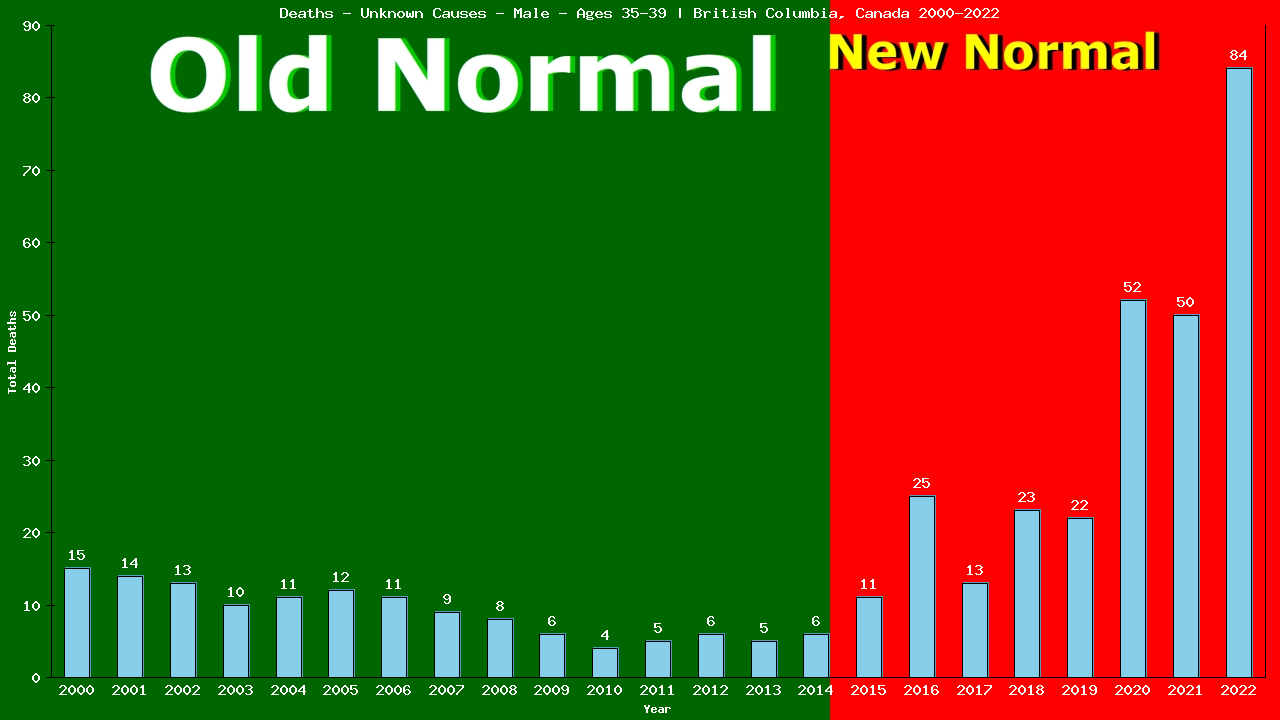
The next 84 of the 1,565 male deaths from Unknown Causes in 2022 were among men aged 35-39, accounting for 26.58% of the 316 total deaths in this group.
This is up 550% compared to Old Normal rates. Those rates, applied to this year's population of 195,575 men aged 35-39, would have predicted 11 deaths from Unknown Causes this year.
This means there were 73 more deaths than expected from Unknown Causes among men aged 35-39 living in British Columbia in 2022.
Overall, 280 deaths from Unknown Causes represent 203 lives lost among men aged 35-39 over the first 8 years of British Columbia's New Normal™.
Click the bar graph above to see how the both the 2022 total of 73 more and the 8 year total of 280 more male aged 35-39 deaths from Unknown Causes is arrived at.
Yearly Unknown Causes Tally: 323 / 1,565
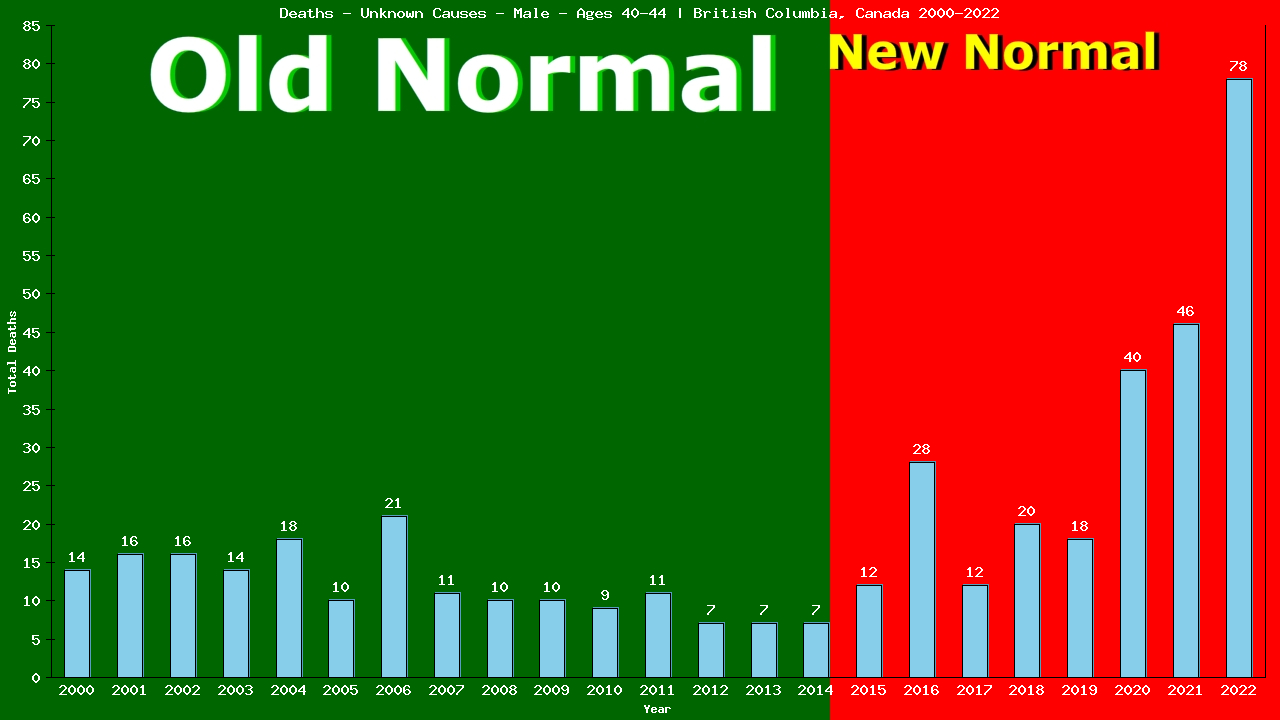
The next 78 of the 1,565 male deaths from Unknown Causes in 2022 were among men aged 40-44, accounting for 24.00% of the 325 total deaths in this group.
This is up 454% compared to Old Normal rates. Those rates, applied to this year's population of 172,516 men aged 40-44, would have predicted 12 deaths from Unknown Causes this year.
This means there were 66 more deaths than expected from Unknown Causes among men aged 40-44 living in British Columbia in 2022.
Overall, 254 deaths from Unknown Causes represent 164 lives lost among men aged 40-44 over the first 8 years of British Columbia's New Normal™.
Click the bar graph above to see how the both the 2022 total of 66 more and the 8 year total of 254 more male aged 40-44 deaths from Unknown Causes is arrived at.
Yearly Unknown Causes Tally: 401 / 1,565
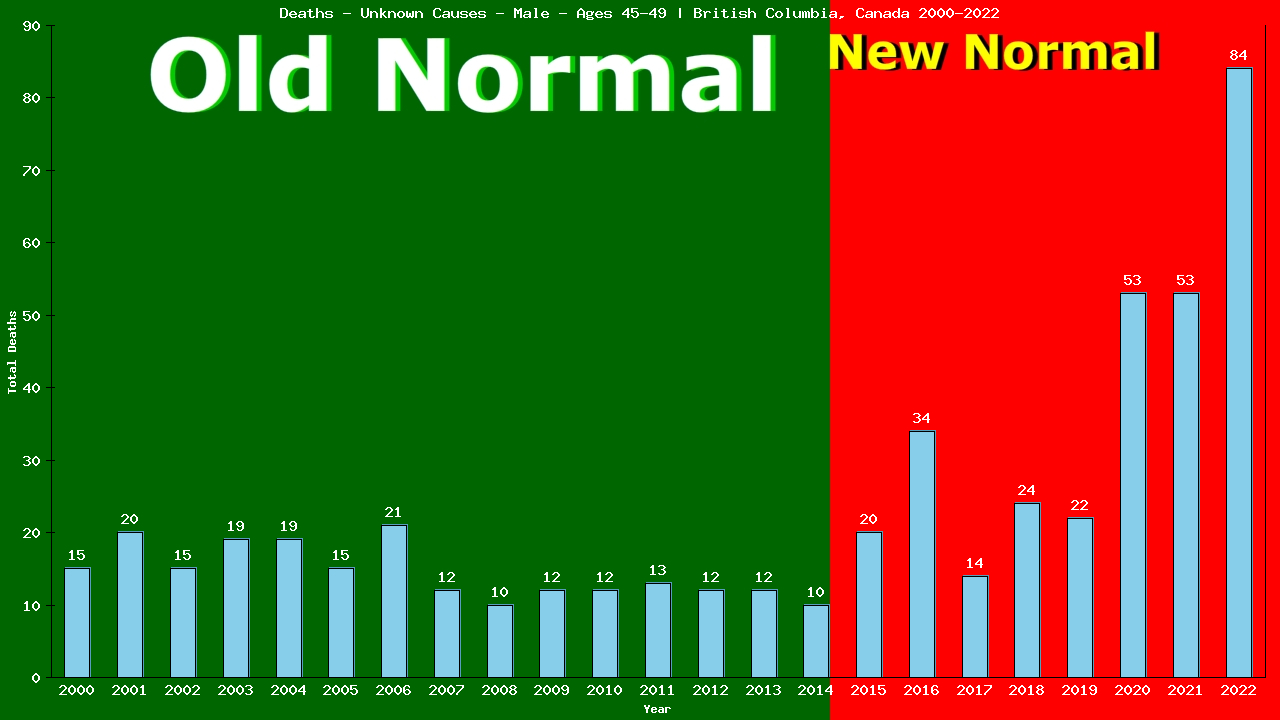
The next 84 of the 1,565 male deaths from Unknown Causes in 2022 were among men aged 45-49, accounting for 18.58% of the 452 total deaths in this group.
This is up 463% compared to Old Normal rates. Those rates, applied to this year's population of 157,756 men aged 45-49, would have predicted 13 deaths from Unknown Causes this year.
This means there were 71 more deaths than expected from Unknown Causes among men aged 45-49 living in British Columbia in 2022.
Overall, 304 deaths from Unknown Causes represent 194 lives lost among men aged 45-49 over the first 8 years of British Columbia's New Normal™.
Click the bar graph above to see how the both the 2022 total of 71 more and the 8 year total of 304 more male aged 45-49 deaths from Unknown Causes is arrived at.
Yearly Unknown Causes Tally: 485 / 1,565
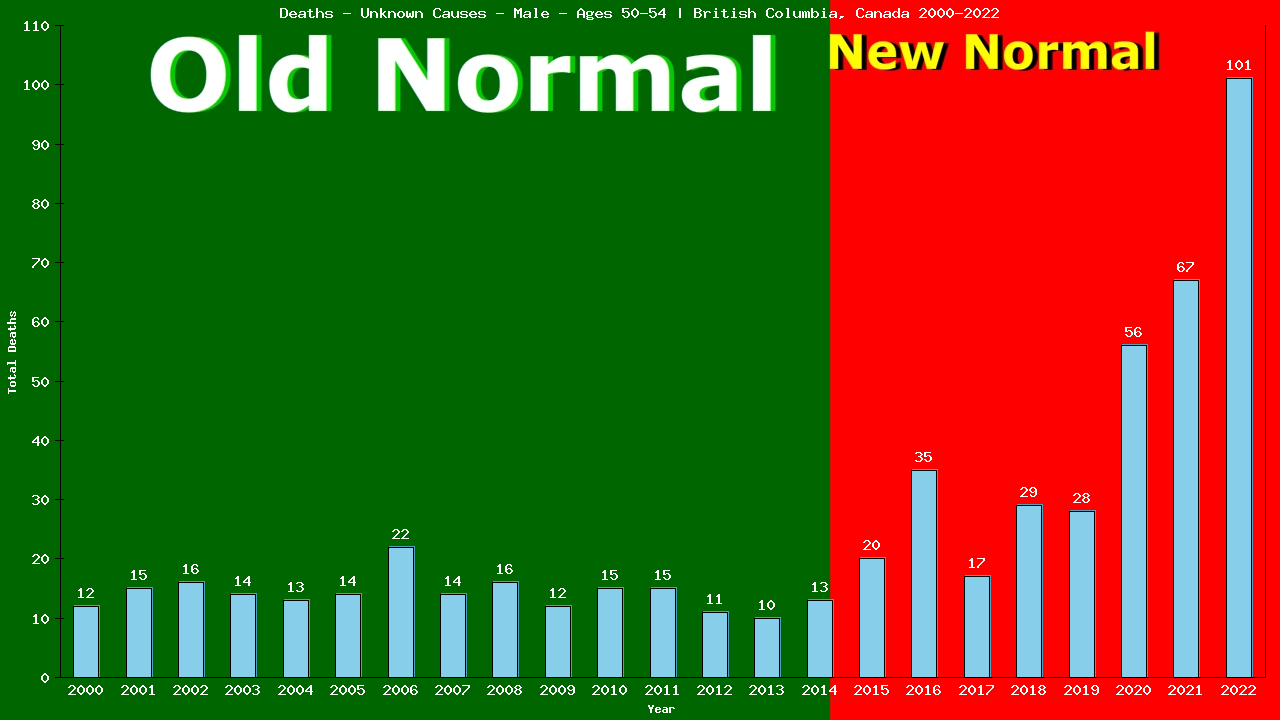
The next 101 of the 1,565 male deaths from Unknown Causes in 2022 were among men aged 50-54, accounting for 15.01% of the 673 total deaths in this group.
This is up 525% compared to Old Normal rates. Those rates, applied to this year's population of 166,750 men aged 50-54, would have predicted 14 deaths from Unknown Causes this year.
This means there were 87 more deaths than expected from Unknown Causes among men aged 50-54 living in British Columbia in 2022.
Overall, 353 deaths from Unknown Causes represent 232 lives lost among men aged 50-54 over the first 8 years of British Columbia's New Normal™.
Click the bar graph above to see how the both the 2022 total of 87 more and the 8 year total of 353 more male aged 50-54 deaths from Unknown Causes is arrived at.
Yearly Unknown Causes Tally: 586 / 1,565
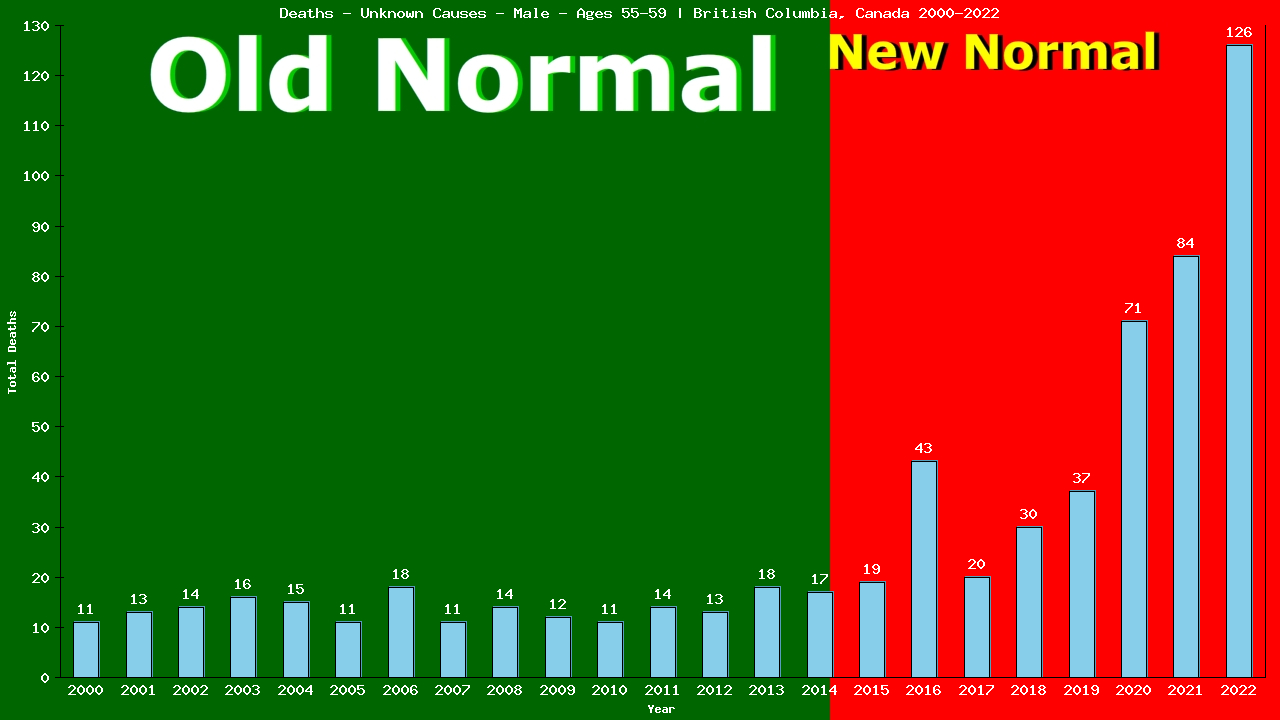
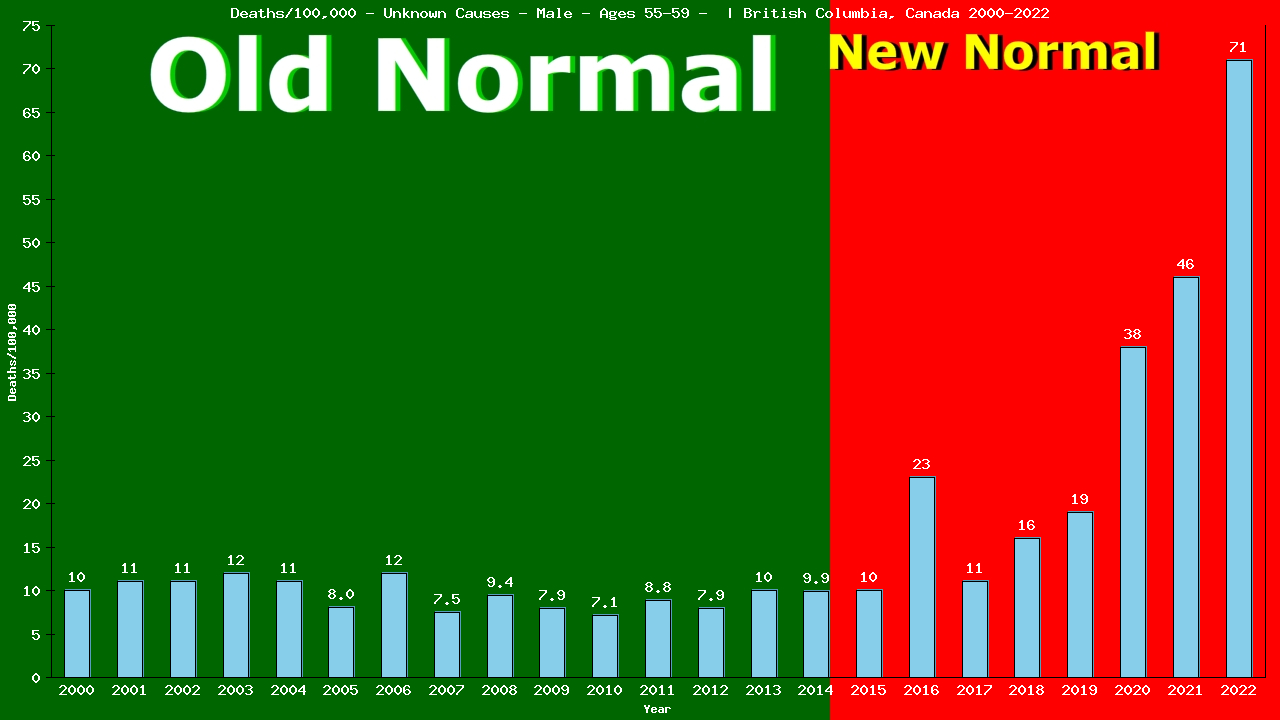
The next 126 of the 1,565 male deaths from Unknown Causes in 2022 were among men aged 55-59, accounting for 11.23% of the 1,122 total deaths in this group.
This is up 564% compared to Old Normal rates. Those rates, applied to this year's population of 177,243 men aged 55-59, would have predicted 17 deaths from Unknown Causes this year.
This means there were 109 more deaths than expected from Unknown Causes among men aged 55-59 living in British Columbia in 2022.
Overall, 430 deaths from Unknown Causes represent 289 lives lost among men aged 55-59 over the first 8 years of British Columbia's New Normal™.
Click the bar graph above to see how the both the 2022 total of 109 more and the 8 year total of 430 more male aged 55-59 deaths from Unknown Causes is arrived at.
Yearly Unknown Causes Tally: 712 / 1,565
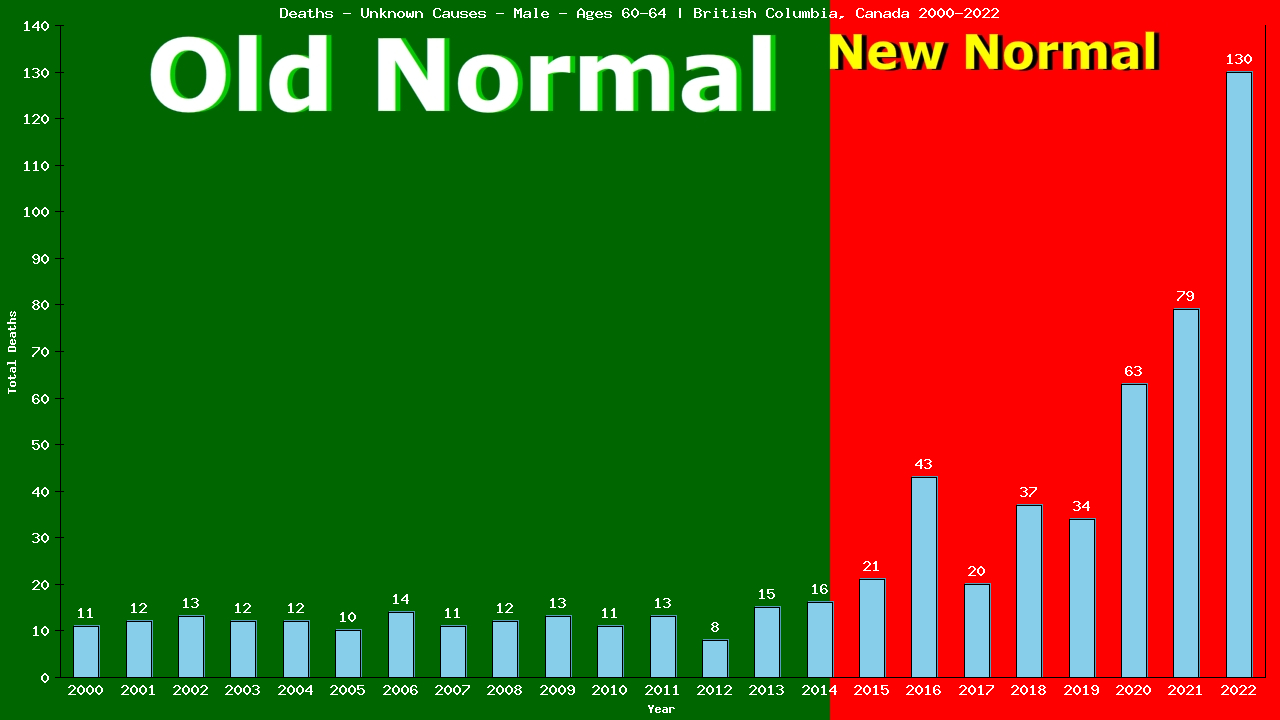
The next 130 of the 1,565 male deaths from Unknown Causes in 2022 were among men aged 60-64, accounting for 8.20% of the 1,585 total deaths in this group.
This is up 546% compared to Old Normal rates. Those rates, applied to this year's population of 178,732 men aged 60-64, would have predicted 18 deaths from Unknown Causes this year.
This means there were 112 more deaths than expected from Unknown Causes among men aged 60-64 living in British Columbia in 2022.
Overall, 427 deaths from Unknown Causes represent 288 lives lost among men aged 60-64 over the first 8 years of British Columbia's New Normal™.
Click the bar graph above to see how the both the 2022 total of 112 more and the 8 year total of 427 more male aged 60-64 deaths from Unknown Causes is arrived at.
Yearly Unknown Causes Tally: 842 / 1,565
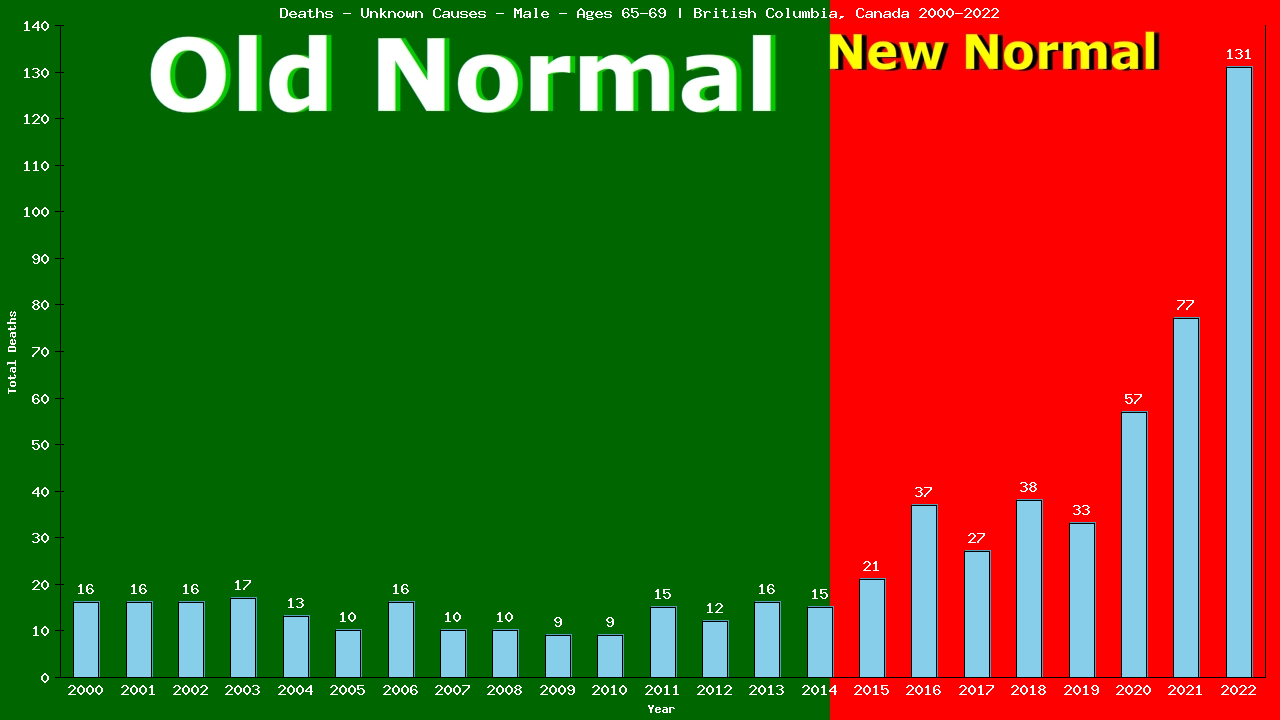
The next 131 of the 1,565 male deaths from Unknown Causes in 2022 were among elderly men aged 65-69, accounting for 6.22% of the 2,105 total deaths in this group.
This is up 449% compared to Old Normal rates. Those rates, applied to this year's population of 158,714 elderly men aged 65-69, would have predicted 22 deaths from Unknown Causes this year.
This means there were 109 more deaths than expected from Unknown Causes among elderly men aged 65-69 living in British Columbia in 2022.
Overall, 421 deaths from Unknown Causes represent 256 lives lost among elderly men aged 65-69 over the first 8 years of British Columbia's New Normal™.
Click the bar graph above to see how the both the 2022 total of 109 more and the 8 year total of 421 more male aged 65-69 deaths from Unknown Causes is arrived at.
Yearly Unknown Causes Tally: 973 / 1,565
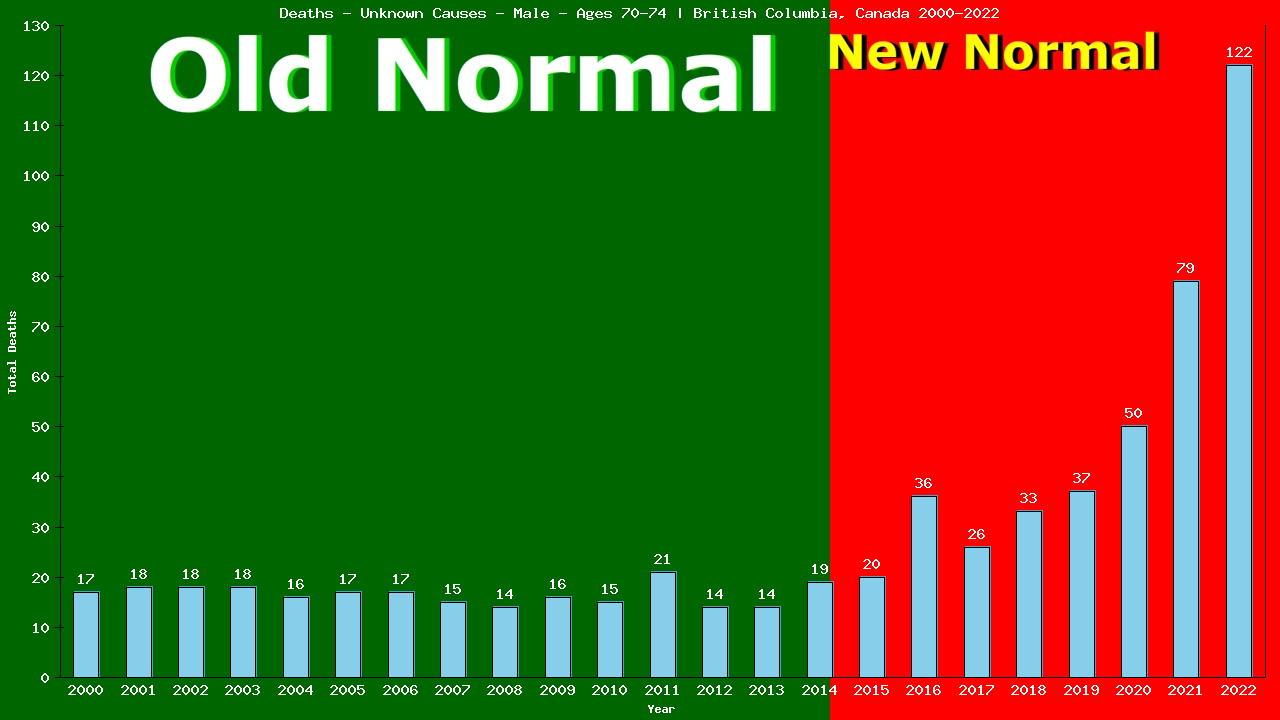
The next 122 of the 1,565 male deaths from Unknown Causes in 2022 were among elderly men aged 70-74, accounting for 4.45% of the 2,739 total deaths in this group.
This is up 292% compared to Old Normal rates. Those rates, applied to this year's population of 132,672 elderly men aged 70-74, would have predicted 30 deaths from Unknown Causes this year.
This means there were 92 more deaths than expected from Unknown Causes among elderly men aged 70-74 living in British Columbia in 2022.
Overall, 403 deaths from Unknown Causes represent 196 lives lost among elderly men aged 70-74 over the first 8 years of British Columbia's New Normal™.
Click the bar graph above to see how the both the 2022 total of 92 more and the 8 year total of 403 more male aged 70-74 deaths from Unknown Causes is arrived at.
Yearly Unknown Causes Tally: 1,095 / 1,565
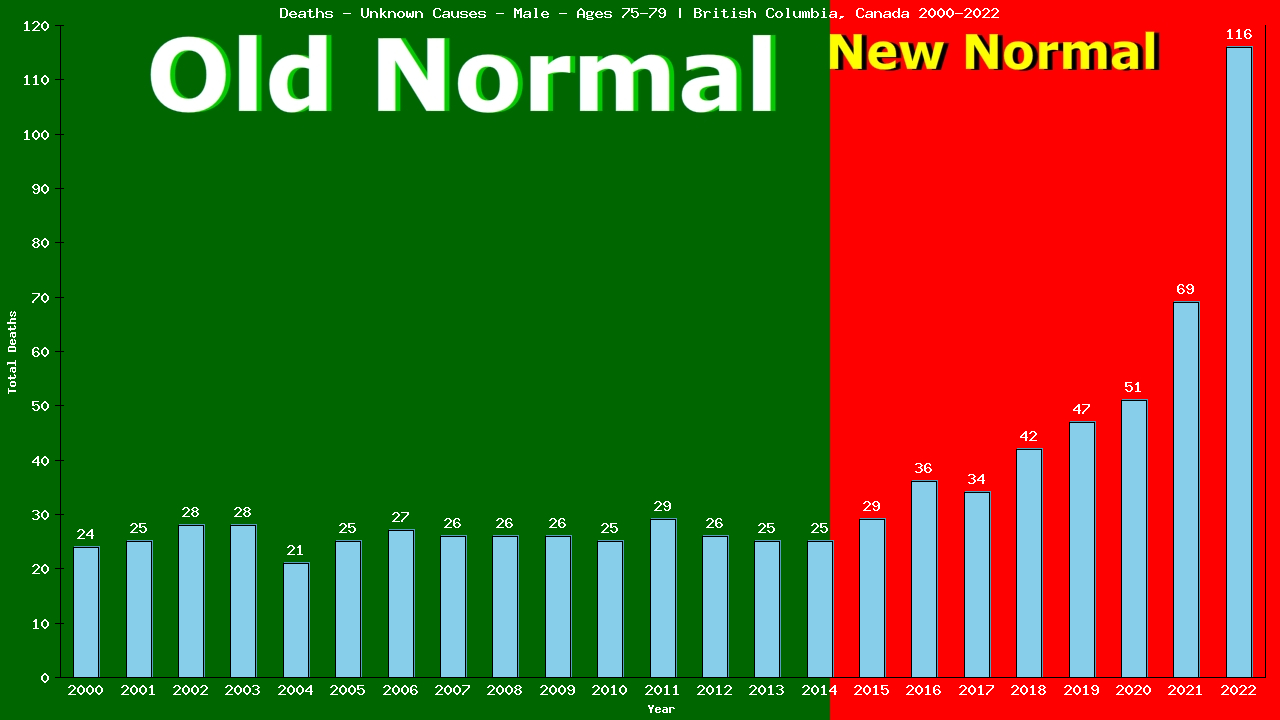
The next 116 of the 1,565 male deaths from Unknown Causes in 2022 were among elderly men aged 75-79, accounting for 3.92% of the 2,961 total deaths in this group.
This is up 163% compared to Old Normal rates. Those rates, applied to this year's population of 94,743 elderly men aged 75-79, would have predicted 43 deaths from Unknown Causes this year.
This means there were 73 more deaths than expected from Unknown Causes among elderly men aged 75-79 living in British Columbia in 2022.
Overall, 424 deaths from Unknown Causes represent 139 lives lost among elderly men aged 75-79 over the first 8 years of British Columbia's New Normal™.
Click the bar graph above to see how the both the 2022 total of 73 more and the 8 year total of 424 more male aged 75-79 deaths from Unknown Causes is arrived at.
Yearly Unknown Causes Tally: 1,211 / 1,565
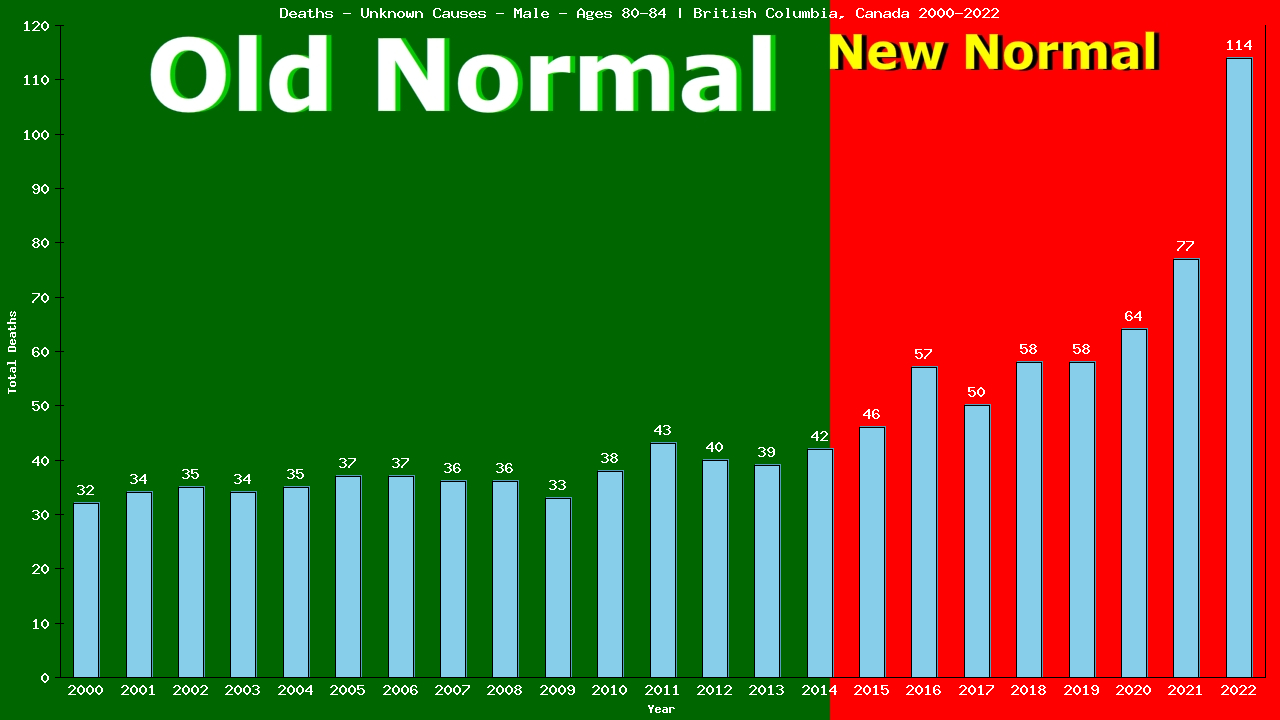
The next 114 of the 1,565 male deaths from Unknown Causes in 2022 were among elderly men aged 80-84, accounting for 3.45% of the 3,304 total deaths in this group.
This is up 103% compared to Old Normal rates. Those rates, applied to this year's population of 57,521 elderly men aged 80-84, would have predicted 55 deaths from Unknown Causes this year.
This means there were 59 more deaths than expected from Unknown Causes among elderly men aged 80-84 living in British Columbia in 2022.
Overall, 524 deaths from Unknown Causes represent 128 lives lost among elderly men aged 80-84 over the first 8 years of British Columbia's New Normal™.
Click the bar graph above to see how the both the 2022 total of 59 more and the 8 year total of 524 more male aged 80-84 deaths from Unknown Causes is arrived at.
Yearly Unknown Causes Tally: 1,325 / 1,565
The next 114 of the 1,565 male deaths from Unknown Causes in 2022 were among elderly men aged 80-84, accounting for 3.45% of the 3,304 total deaths in this group.
This is up 103% compared to Old Normal rates. Those rates, applied to this year's population of 57,521 elderly men aged 80-84, would have predicted 55 deaths from Unknown Causes this year.
This means there were 59 more deaths than expected from Unknown Causes among elderly men aged 80-84 living in British Columbia in 2022.
Overall, 524 deaths from Unknown Causes represent 128 lives lost among elderly men aged 80-84 over the first 8 years of British Columbia's New Normal™.
Click the bar graph above to see how the both the 2022 total of 59 more and the 8 year total of 524 more male aged 80-84 deaths from Unknown Causes is arrived at.
Yearly Unknown Causes Tally: 1,439 / 1,565
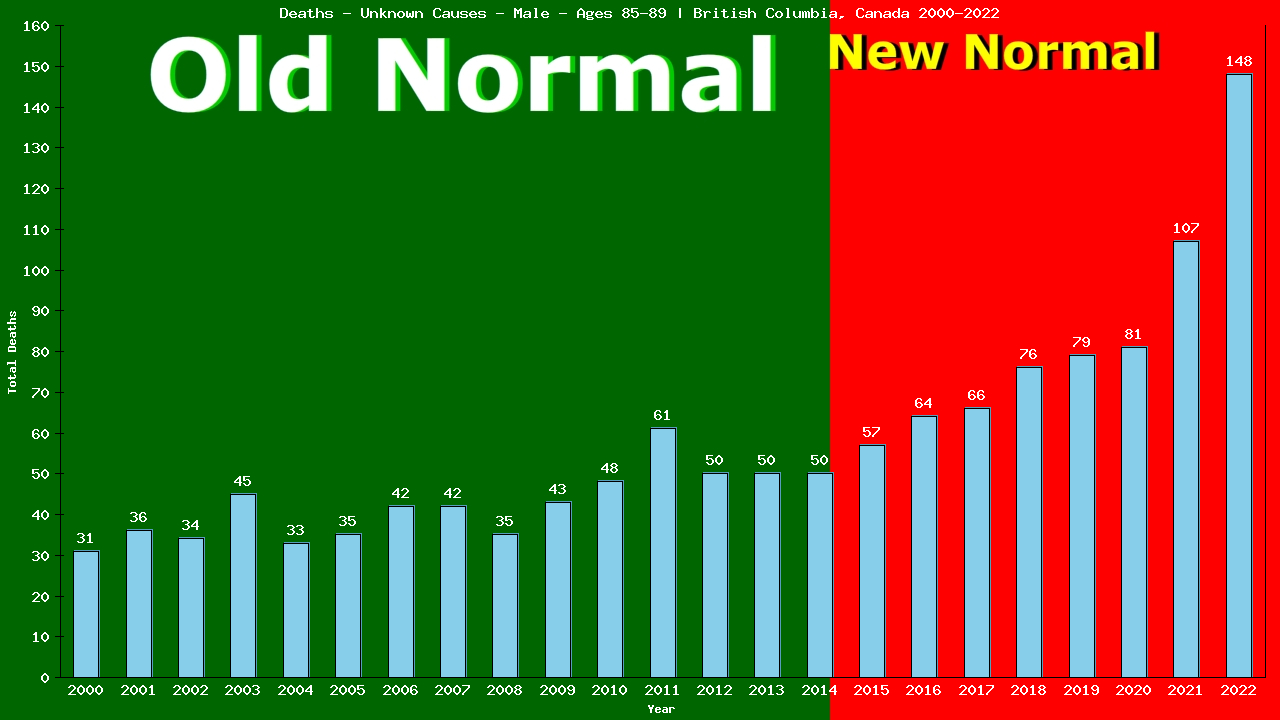
The next 148 of the 1,565 male deaths from Unknown Causes in 2022 were among elderly men aged 85-89, accounting for 3.75% of the 3,945 total deaths in this group.
This is up 107% compared to Old Normal rates. Those rates, applied to this year's population of 32,371 elderly men aged 85-89, would have predicted 71 deaths from Unknown Causes this year.
This means there were 77 more deaths than expected from Unknown Causes among elderly men aged 85-89 living in British Columbia in 2022.
Overall, 678 deaths from Unknown Causes represent 150 lives lost among elderly men aged 85-89 over the first 8 years of British Columbia's New Normal™.
Click the bar graph above to see how the both the 2022 total of 77 more and the 8 year total of 678 more male aged 85-89 deaths from Unknown Causes is arrived at.
Yearly Unknown Causes Tally: 1,587 / 1,565
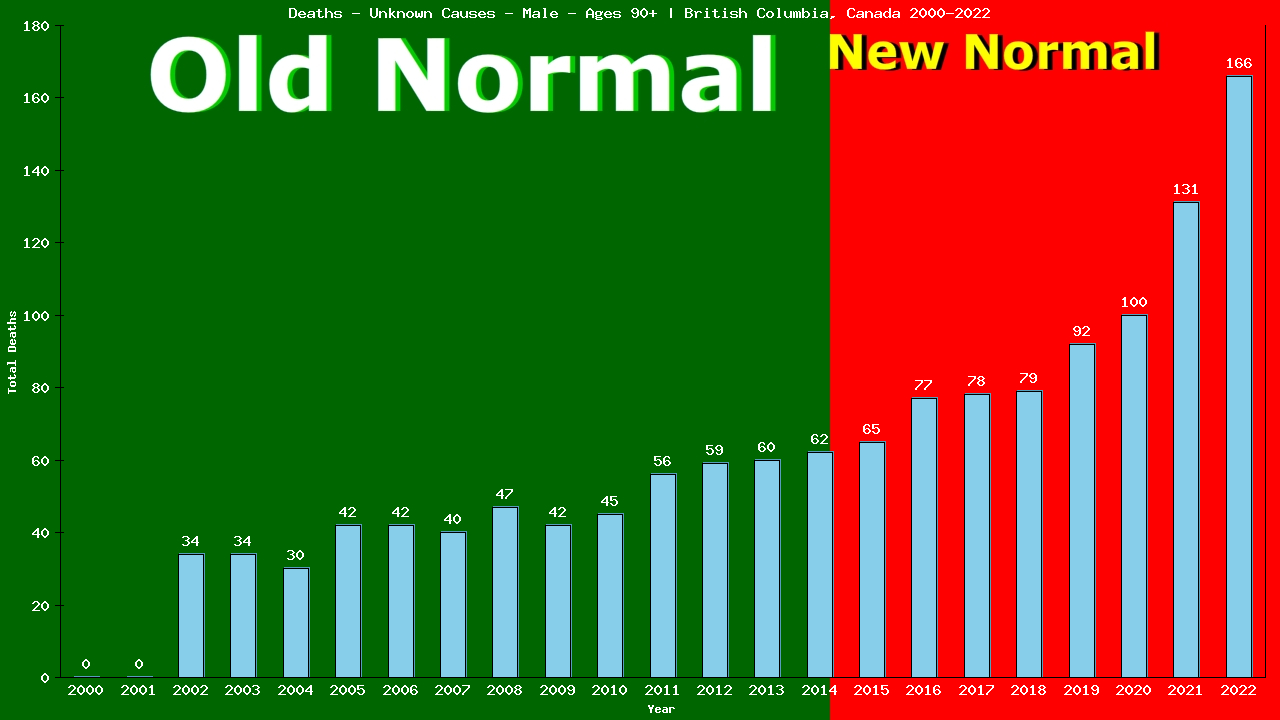
The next 166 of the 1,565 deaths from Unknown Causes in 2022 were among elderly men aged 90+, accounting for 4.41% of the 3,766 total deaths in this group.
This is up 87% compared to Old Normal rates which, when applied to this year's population of 17,194 would have predicted 88 deaths from Unknown Causes this year.
This means there were 78 more deaths than expected from Unknown Causes among elderly men aged 90+ living in British Columbia in 2022.
Overall, 788 deaths from Unknown Causes represent 172 lives lost among elderly men aged 90+ over the first 8 years of British Columbia's New Normal™.
Click the bar graph above to see how the 8 year total of 788 excess male deaths from Unknown Causes is arrived at.
Yearly Unknown Causes Tally: 1,753 / 1,565*
* British Columbia does not report the deaths of 188 babies in it's death totals
×
![]()


![Graph showing Populalation - Male - Aged 55-59 - [2001-2022] | British Columbia, Canada](/wp-content/plugins/dfuc-display/charts/canada/british-columbia/2022/all/Male/55-59-pop.png)