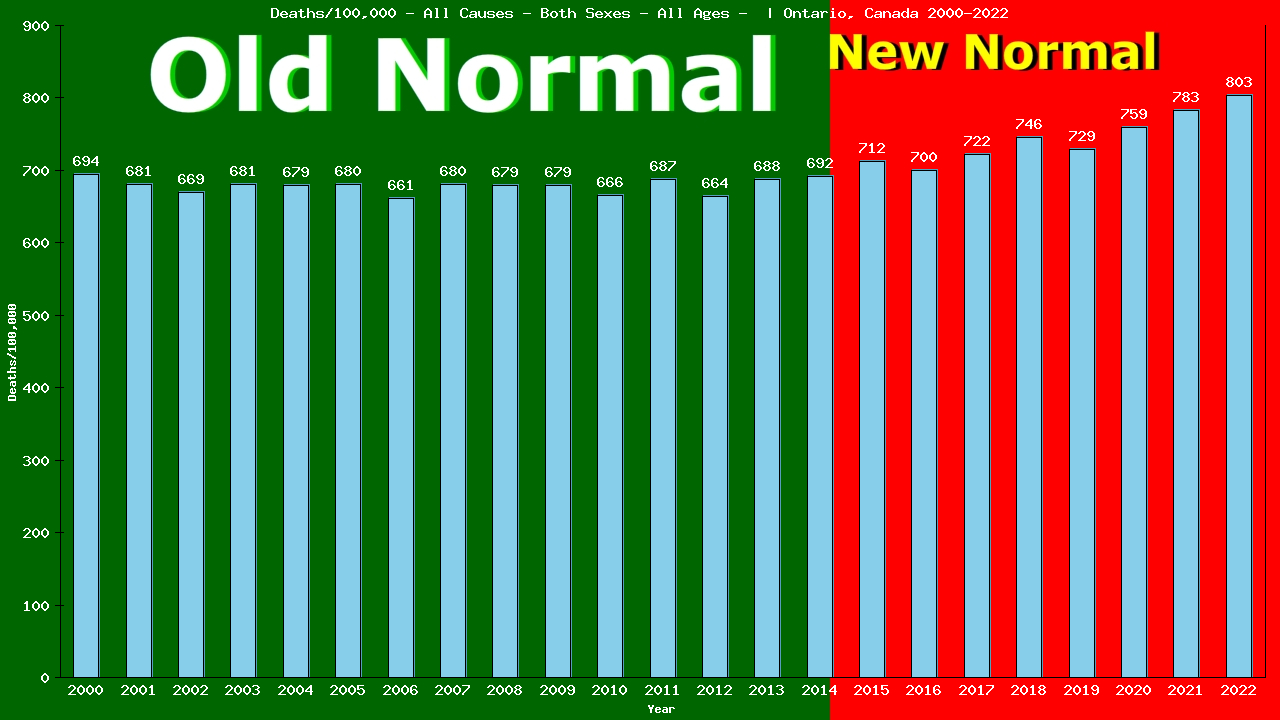
2022 vs New Normal™ for individuals of all ages in Ontario
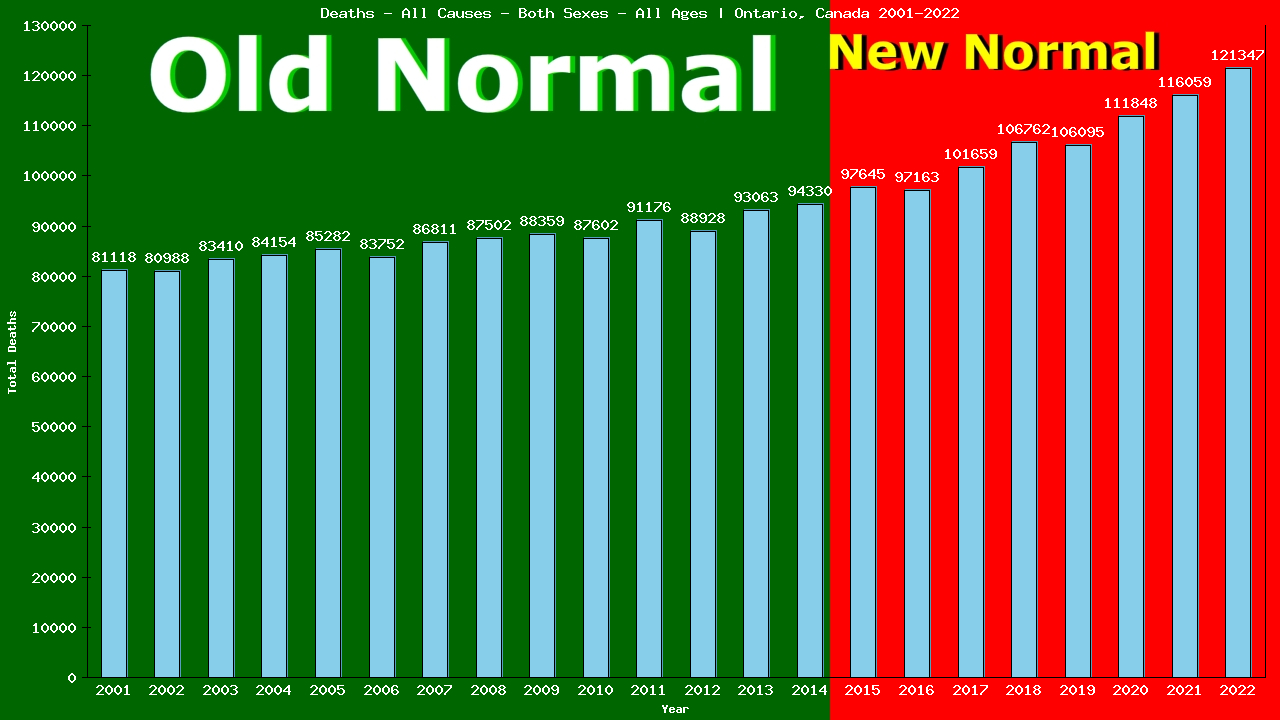
121,347 of 121,347 total deaths were from All Causes
100.00% of all deaths were from All Causes
This is up 18% compared to Old Normal rates.
102,616 of 102,616 total deaths would have been expected under Old Normal conditions.
18,731 more deaths from All Causes in 2022.
76,530 more deaths from All Causes (2015-2022)
To show this year’s deaths from All Causes are up 18% compared to Old Normal rates, we need to calculate the rates for both 2022 and for the Old Normal.
Remember, death rates are calculated to answer these questions:
“How many individuals of all ages were there?” and
“How many of them died from All Causes?”
The following 2 charts provide this information:
Deaths – All Causes – Both Sexes – Of All Ages | Ontario, Canada
Populalation – Both Sexes – Of All Ages – [2000-2022] | Ontario, Canada
From the charts, we can see that in 2022, 121,347 of 15,109,416 individuals of all ages living in Ontario died from All Causes.
121,347 ÷ 15,109,416 = 0.00803 (2022 CDR)
We’ll use the table below to calculate our Old Normal rate for deaths from All Causes
Old Normal (2001-2014) Ontario both sexes of all ages All Causes
Year
Pop
Died
From
|2000
11,683,290
81,145
81,145
|2001
11,897,534
81,118
81,118
|2002
12,094,174
80,988
80,988
|2003
12,245,039
83,410
83,410
|2004
12,391,421
84,154
84,154
|Year
Pop
Died
From
|2005
12,528,663
85,282
85,282
|2006
12,661,878
83,752
83,752
|2007
12,764,806
86,811
86,811
|2008
12,883,583
87,502
87,502
|2009
12,998,345
88,359
88,359
|Year
Pop
Died
From
|2010
13,135,778
87,602
87,602
|2011
13,261,381
91,176
91,176
|2012
13,390,632
88,928
88,928
|2013
13,510,781
93,063
93,063
|2014
13,617,553
94,330
94,330
Cumulative:
Population
Deaths
All Causes
Totals:
191,064,858
1,297,620
1,297,620
The table shows there were a total of 1,297,620 deaths from All Causes among 191,064,858 individuals of all ages living in Ontario in the 15 years immediately prior to the New Normal™.
1,297,620 ÷ 191,064,858 = 0.00679 (Old Normal CDR)
We can use the Old Normal rate to predict this year’s deaths:
2022 pop X Old Normal CDR = expected deaths
15,109,416 X 0.00679 = 102,616 expected deaths
The difference between actual and expected deaths shows lives saved or lost:
121,347 – 102,616 = 18,731
Dividing the actual deaths by the expected deaths gives us the comparative rates:
121,347 ÷ 102,616 = 1.1808
This reveals 18,731 lives lost and is 118.08% of what we expected (an increase of 18%) in deaths from All Causes among individuals of all ages living in Ontario in 2022, as compared to the Old Normal.
Compare our Old Normal to the 5yr CDR. Does it tell the same story your TV does?
5yr CDR (2017-2021)
Year
Pop
Died
From
|2017
14,070,141
101,659
101,659
|2018
14,308,697
106,762
106,762
|2019
14,544,701
106,095
106,095
|2020
14,726,022
111,848
111,848
|2021
14,809,257
116,059
116,059
Total:
100,041,330
737,231
737,231
This is the same method used by Public Health to calculate the 5-yr CDR (Cumulative Death Rate):
737,231 ÷ 100,041,330 = 0.00737 (5-yr CDR)
15,109,416(2022 pop) X 0.00737 = 111,345 expected deaths
The difference between actual and expected deaths:
121,347 – 111,345 = 10,002 or 10,002 lives lost
Divide actual deaths by expected deaths:
121,347 ÷ 111,345 = 1.0883 or an increase of 9%
for deaths from All Causes among individuals of all ages living in Ontario in 2022, as compared to the previous 5 years.
Finally, the same method can also be used to compare our Old Normal rate to the New Normal™ rate:
New Normal™ population X Old Normal rate = expected deaths
115,150,746 X 0.00679 = 782,048 expected deaths
The difference between actual and expected deaths:
858578 – 782,048 = 76,530 or 76,530 lives lost
Dividing the actual deaths by the expected deaths:
858,578 ÷ 782,048 = 1.0962 or an increase of 10%
in deaths from All Causes among individuals of all ages living in Ontario in the New Normal™, as compared to the Old Normal.
New Normal (2015-2022)
Year
Pop
Died
From
|2015
13,707,118
97,645
97,645
|2016
13,875,394
97,163
97,163
|2017
14,070,141
101,659
101,659
|2018
14,308,697
106,762
106,762
|2019
14,544,701
106,095
106,095
|2020
14,726,022
111,848
111,848
|2021
14,809,257
116,059
116,059
|2022
15,109,416
121,347
121,347
Total:
115,150,746
858,578
858,578
The world has been led to believe that a deadly pandemic swept the globe beginning in 2020, causing an increase in death rates, especially among the elderly
The data show that death rates began to increase in 2015, immediately upon implementation of the UN’s 2030 Agenda for Sustainable Development, that young adults have experienced ever-increasing death rates since, and that death rates among the elderly have remained relatively stable.
Browse through the age-categorized charts below to see the evidence of this. Click on any chart to see the full analysis for each age group.
121,347 of the 121,347 deaths among individuals of all ages living in Ontario in 2022 were from All Causes (100.00% of all deaths).
This is up 18% compared to Old Normal (2000-2014) rates which, when applied to the this year's both sexes population of 15,109,416 individuals would have predicted 102,616 deaths from All Causes.
This means there were 18,731 more deaths than expected from All Causes among individuals of all ages living in Ontario in 2022.
To date, 76,530 individual lives have been lost to All Causes over the first 8 years of Ontario's New Normal™.
Browse through the age categories below to learn how these deaths from All Causes in 2022 are distributed among each age group of individuals in Ontario.
Click the bar graph above to see how both the 2022 loss of 18,731 lives and the 8-year loss of 76,530 individual lives from All Causes is arrived at.
The first 736 of the 121,347 deaths from All Causes in 2022 were among pre-schoolers aged 0-4, accounting for 100.00% of the 736 total deaths in this group.
This is down 13% compared to Old Normal rates which, when applied to this year's population of 714,650 pre-schoolers aged 0-4, would have predicted 835 deaths from All Causes this year.
This means there were 99 fewer deaths than expected from All Causes among pre-schoolers aged 0-4 living in Ontario in 2022.
Overall, 5,859 deaths from All Causes represent 842 lives saved among pre-schoolers aged 0-4 over the first 8 years of Ontario's New Normal™.
Click the bar graph above to see how both the 2022 total of 99 fewer live lost than expected and the 8 year total of 5859 lives saved from All Causes among pre-schoolers aged 0-4 is arrived at.
Yearly All Causes Tally: 736 / 121,347
The next 60 of the 121,347 individual deaths from All Causes in 2022 were among children aged 5-9, accounting for 99.98% of the 60 total deaths in this group.
This is down 23% compared to Old Normal rates. Those rates, applied to this year's population of 769,057 children aged 5-9, would have predicted 70 deaths from All Causes this year.
This means there were 10 fewer deaths than expected from All Causes among children aged 5-9 living in Ontario in 2022.
Overall, 457 deaths from All Causes represent 101 lives saved among children aged 5-9 over the first 8 years of Ontario's New Normal™.
Click the bar graph above to see how the both the 2022 total of 10 fewer and the 8 year total of 457 fewer individual aged 5-9 deaths from All Causes is arrived at.
Yearly All Causes Tally: 796 / 121,347
The next 82 of the 121,347 individual deaths from All Causes in 2022 were among children aged 10-14, accounting for 99.99% of the 82 total deaths in this group.
This is down 26% compared to Old Normal rates. Those rates, applied to this year's population of 803,894 children aged 10-14, would have predicted 103 deaths from All Causes this year.
This means there were 21 fewer deaths than expected from All Causes among children aged 10-14 living in Ontario in 2022.
Overall, 686 deaths from All Causes represent 111 lives saved among children aged 10-14 over the first 8 years of Ontario's New Normal™.
Click the bar graph above to see how the both the 2022 total of 21 fewer and the 8 year total of 686 fewer individual aged 10-14 deaths from All Causes is arrived at.
Yearly All Causes Tally: 878 / 121,347
The next 288 of the 121,347 individual deaths from All Causes in 2022 were among teens aged 15-19, accounting for 100.00% of the 288 total deaths in this group.
This is down 9% compared to Old Normal rates. Those rates, applied to this year's population of 849,796 teens aged 15-19, would have predicted 307 deaths from All Causes this year.
This means there were 19 fewer deaths than expected from All Causes among teens aged 15-19 living in Ontario in 2022.
Overall, 2,141 deaths from All Causes represent 310 lives saved among teens aged 15-19 over the first 8 years of Ontario's New Normal™.
Click the bar graph above to see how the both the 2022 total of 19 fewer and the 8 year total of 2,141 fewer individual aged 15-19 deaths from All Causes is arrived at.
Yearly All Causes Tally: 1,166 / 121,347
The next 535 of the 121,347 individual deaths from All Causes in 2022 were among people aged 20-24, accounting for 100.00% of the 535 total deaths in this group.
This is up 12% compared to Old Normal rates. Those rates, applied to this year's population of 1,057,363 people aged 20-24, would have predicted 468 deaths from All Causes this year.
This means there were 67 more deaths than expected from All Causes among people aged 20-24 living in Ontario in 2022.
Overall, 3,944 deaths from All Causes represent 392 lives lost among people aged 20-24 over the first 8 years of Ontario's New Normal™.
Click the bar graph above to see how the both the 2022 total of 67 more and the 8 year total of 3,944 more individual aged 20-24 deaths from All Causes is arrived at.
Yearly All Causes Tally: 1,701 / 121,347
The next 764 of the 121,347 individual deaths from All Causes in 2022 were among people aged 25-29, accounting for 100.00% of the 764 total deaths in this group.
This is up 38% compared to Old Normal rates. Those rates, applied to this year's population of 1,125,870 people aged 25-29, would have predicted 542 deaths from All Causes this year.
This means there were 222 more deaths than expected from All Causes among people aged 25-29 living in Ontario in 2022.
Overall, 5,164 deaths from All Causes represent 1,224 lives lost among people aged 25-29 over the first 8 years of Ontario's New Normal™.
Click the bar graph above to see how the both the 2022 total of 222 more and the 8 year total of 5,164 more individual aged 25-29 deaths from All Causes is arrived at.
Yearly All Causes Tally: 2,465 / 121,347
The next 865 of the 121,347 individual deaths from All Causes in 2022 were among people aged 30-34, accounting for 100.00% of the 865 total deaths in this group.
This is up 30% compared to Old Normal rates. Those rates, applied to this year's population of 1,103,727 people aged 30-34, would have predicted 657 deaths from All Causes this year.
This means there were 208 more deaths than expected from All Causes among people aged 30-34 living in Ontario in 2022.
Overall, 5,913 deaths from All Causes represent 1,165 lives lost among people aged 30-34 over the first 8 years of Ontario's New Normal™.
Click the bar graph above to see how the both the 2022 total of 208 more and the 8 year total of 5,913 more individual aged 30-34 deaths from All Causes is arrived at.
Yearly All Causes Tally: 3,330 / 121,347
The next 996 of the 121,347 individual deaths from All Causes in 2022 were among people aged 35-39, accounting for 100.00% of the 996 total deaths in this group.
This is up 12% compared to Old Normal rates. Those rates, applied to this year's population of 1,042,231 people aged 35-39, would have predicted 879 deaths from All Causes this year.
This means there were 117 more deaths than expected from All Causes among people aged 35-39 living in Ontario in 2022.
Overall, 6,871 deaths from All Causes represent 435 lives lost among people aged 35-39 over the first 8 years of Ontario's New Normal™.
Click the bar graph above to see how the both the 2022 total of 117 more and the 8 year total of 6,871 more individual aged 35-39 deaths from All Causes is arrived at.
Yearly All Causes Tally: 4,326 / 121,347
The next 1,188 of the 121,347 individual deaths from All Causes in 2022 were among people aged 40-44, accounting for 100.00% of the 1,188 total deaths in this group.
This is down 5% compared to Old Normal rates. Those rates, applied to this year's population of 953,615 people aged 40-44, would have predicted 1,239 deaths from All Causes this year.
This means there were 51 fewer deaths than expected from All Causes among people aged 40-44 living in Ontario in 2022.
Overall, 9,020 deaths from All Causes represent 532 lives saved among people aged 40-44 over the first 8 years of Ontario's New Normal™.
Click the bar graph above to see how the both the 2022 total of 51 fewer and the 8 year total of 9,020 fewer individual aged 40-44 deaths from All Causes is arrived at.
Yearly All Causes Tally: 5,514 / 121,347
The next 1,776 of the 121,347 individual deaths from All Causes in 2022 were among people aged 45-49, accounting for 100.00% of the 1,776 total deaths in this group.
This is down 8% compared to Old Normal rates. Those rates, applied to this year's population of 920,106 people aged 45-49, would have predicted 1,918 deaths from All Causes this year.
This means there were 142 fewer deaths than expected from All Causes among people aged 45-49 living in Ontario in 2022.
Overall, 13,964 deaths from All Causes represent 1,762 lives saved among people aged 45-49 over the first 8 years of Ontario's New Normal™.
Click the bar graph above to see how the both the 2022 total of 142 fewer and the 8 year total of 13,964 fewer individual aged 45-49 deaths from All Causes is arrived at.
Yearly All Causes Tally: 7,290 / 121,347
The next 2,971 of the 121,347 individual deaths from All Causes in 2022 were among people aged 50-54, accounting for 100.00% of the 2,971 total deaths in this group.
This is down 6% compared to Old Normal rates. Those rates, applied to this year's population of 952,495 people aged 50-54, would have predicted 3,145 deaths from All Causes this year.
This means there were 174 fewer deaths than expected from All Causes among people aged 50-54 living in Ontario in 2022.
Overall, 24,666 deaths from All Causes represent 2,110 lives saved among people aged 50-54 over the first 8 years of Ontario's New Normal™.
Click the bar graph above to see how the both the 2022 total of 174 fewer and the 8 year total of 24,666 fewer individual aged 50-54 deaths from All Causes is arrived at.
Yearly All Causes Tally: 10,261 / 121,347
The next 5,274 of the 121,347 individual deaths from All Causes in 2022 were among people aged 55-59, accounting for 100.00% of the 5,274 total deaths in this group.
This is down 2% compared to Old Normal rates. Those rates, applied to this year's population of 1,037,511 people aged 55-59, would have predicted 5,344 deaths from All Causes this year.
This means there were 70 fewer deaths than expected from All Causes among people aged 55-59 living in Ontario in 2022.
Overall, 39,449 deaths from All Causes represent 3,349 lives saved among people aged 55-59 over the first 8 years of Ontario's New Normal™.
Click the bar graph above to see how the both the 2022 total of 70 fewer and the 8 year total of 39,449 fewer individual aged 55-59 deaths from All Causes is arrived at.
Yearly All Causes Tally: 15,535 / 121,347
The next 7,383 of the 121,347 individual deaths from All Causes in 2022 were among people aged 60-64, accounting for 100.00% of the 7,383 total deaths in this group.
This is down 9% compared to Old Normal rates. Those rates, applied to this year's population of 1,004,859 people aged 60-64, would have predicted 8,133 deaths from All Causes this year.
This means there were 750 fewer deaths than expected from All Causes among people aged 60-64 living in Ontario in 2022.
Overall, 53,447 deaths from All Causes represent 6,271 lives saved among people aged 60-64 over the first 8 years of Ontario's New Normal™.
Click the bar graph above to see how the both the 2022 total of 750 fewer and the 8 year total of 53,447 fewer individual aged 60-64 deaths from All Causes is arrived at.
Yearly All Causes Tally: 22,918 / 121,347
The next 9,201 of the 121,347 individual deaths from All Causes in 2022 were among elderly men and women aged 65-69, accounting for 100.00% of the 9,201 total deaths in this group.
This is down 17% compared to Old Normal rates. Those rates, applied to this year's population of 855,430 elderly men and women aged 65-69, would have predicted 11,113 deaths from All Causes this year.
This means there were 1,912 fewer deaths than expected from All Causes among elderly men and women aged 65-69 living in Ontario in 2022.
Overall, 67,537 deaths from All Causes represent 13,346 lives saved among elderly men and women aged 65-69 over the first 8 years of Ontario's New Normal™.
Click the bar graph above to see how the both the 2022 total of 1,912 fewer and the 8 year total of 67,537 fewer individual aged 65-69 deaths from All Causes is arrived at.
Yearly All Causes Tally: 32,119 / 121,347
The next 12,187 of the 121,347 individual deaths from All Causes in 2022 were among elderly men and women aged 70-74, accounting for 100.00% of the 12,187 total deaths in this group.
This is down 19% compared to Old Normal rates. Those rates, applied to this year's population of 702,728 elderly men and women aged 70-74, would have predicted 14,967 deaths from All Causes this year.
This means there were 2,780 fewer deaths than expected from All Causes among elderly men and women aged 70-74 living in Ontario in 2022.
Overall, 83,537 deaths from All Causes represent 22,060 lives saved among elderly men and women aged 70-74 over the first 8 years of Ontario's New Normal™.
Click the bar graph above to see how the both the 2022 total of 2,780 fewer and the 8 year total of 83,537 fewer individual aged 70-74 deaths from All Causes is arrived at.
Yearly All Causes Tally: 44,306 / 121,347
The next 13,594 of the 121,347 individual deaths from All Causes in 2022 were among elderly men and women aged 75-79, accounting for 100.00% of the 13,594 total deaths in this group.
This is down 26% compared to Old Normal rates. Those rates, applied to this year's population of 523,726 elderly men and women aged 75-79, would have predicted 18,419 deaths from All Causes this year.
This means there were 4,825 fewer deaths than expected from All Causes among elderly men and women aged 75-79 living in Ontario in 2022.
Overall, 96,686 deaths from All Causes represent 27,315 lives saved among elderly men and women aged 75-79 over the first 8 years of Ontario's New Normal™.
Click the bar graph above to see how the both the 2022 total of 4,825 fewer and the 8 year total of 96,686 fewer individual aged 75-79 deaths from All Causes is arrived at.
Yearly All Causes Tally: 57,900 / 121,347
The next 16,458 of the 121,347 individual deaths from All Causes in 2022 were among elderly men and women aged 80-84, accounting for 100.00% of the 16,458 total deaths in this group.
This is down 17% compared to Old Normal rates. Those rates, applied to this year's population of 342,057 elderly men and women aged 80-84, would have predicted 19,756 deaths from All Causes this year.
This means there were 3,298 fewer deaths than expected from All Causes among elderly men and women aged 80-84 living in Ontario in 2022.
Overall, 121,811 deaths from All Causes represent 21,516 lives saved among elderly men and women aged 80-84 over the first 8 years of Ontario's New Normal™.
Click the bar graph above to see how the both the 2022 total of 3,298 fewer and the 8 year total of 121,811 fewer individual aged 80-84 deaths from All Causes is arrived at.
Yearly All Causes Tally: 74,358 / 121,347
The next 16,458 of the 121,347 individual deaths from All Causes in 2022 were among elderly men and women aged 80-84, accounting for 100.00% of the 16,458 total deaths in this group.
This is down 17% compared to Old Normal rates. Those rates, applied to this year's population of 342,057 elderly men and women aged 80-84, would have predicted 19,756 deaths from All Causes this year.
This means there were 3,298 fewer deaths than expected from All Causes among elderly men and women aged 80-84 living in Ontario in 2022.
Overall, 121,811 deaths from All Causes represent 21,516 lives saved among elderly men and women aged 80-84 over the first 8 years of Ontario's New Normal™.
Click the bar graph above to see how the both the 2022 total of 3,298 fewer and the 8 year total of 121,811 fewer individual aged 80-84 deaths from All Causes is arrived at.
Yearly All Causes Tally: 90,816 / 121,347
The next 20,527 of the 121,347 individual deaths from All Causes in 2022 were among elderly men and women aged 85-89, accounting for 100.00% of the 20,527 total deaths in this group.
This is up 0% compared to Old Normal rates. Those rates, applied to this year's population of 210,952 elderly men and women aged 85-89, would have predicted 20,457 deaths from All Causes this year.
This means there were 70 more deaths than expected from All Causes among elderly men and women aged 85-89 living in Ontario in 2022.
Overall, 143,179 deaths from All Causes represent 11,128 lives saved among elderly men and women aged 85-89 over the first 8 years of Ontario's New Normal™.
Click the bar graph above to see how the both the 2022 total of 70 more and the 8 year total of 143,179 more individual aged 85-89 deaths from All Causes is arrived at.
Yearly All Causes Tally: 111,343 / 121,347
The next 26,462 of the 121,347 deaths from All Causes in 2022 were among elderly men and women aged 90+, accounting for 100.00% of the 26,462 total deaths in this group.
This is down 15% compared to Old Normal rates which, when applied to this year's population of 139,349 would have predicted 30,959 deaths from All Causes this year.
This means there were 4,497 fewer deaths than expected from All Causes among elderly men and women aged 90+ living in Ontario in 2022.
Overall, 174,247 deaths from All Causes represent 48,770 lives saved among elderly men and women aged 90+ over the first 8 years of Ontario's New Normal™.
Click the bar graph above to see how the 8 year total of 174,247 excess individual deaths from All Causes is arrived at.
Yearly All Causes Tally: 137,805 / 121,347*
* Ontario does not report the deaths of 16,458 babies in it's death totals