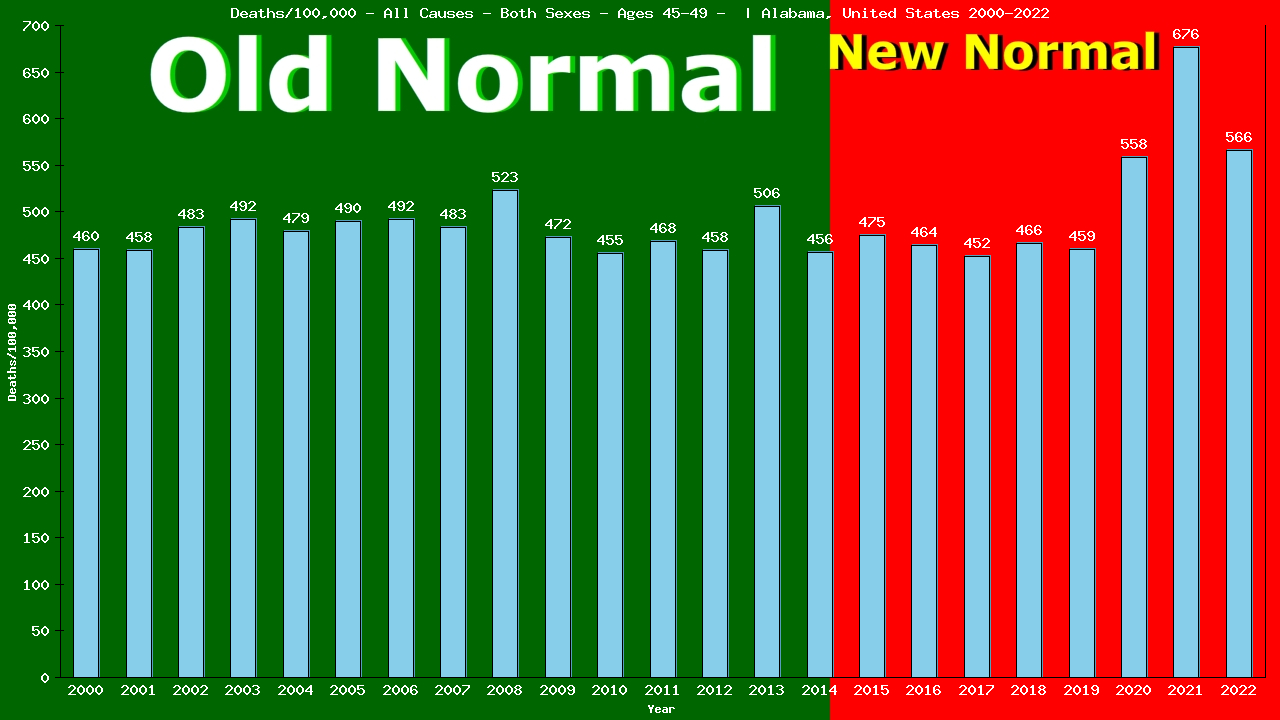
2022 vs New Normal™ for people aged 45-49 in Alabama
1,678 of 1,678 total deaths were from All Causes
100.00% of all deaths were from All Causes
This is up 18% compared to Old Normal rates.
1,420 of 1,420 total deaths would have been expected under Old Normal conditions.
258 more deaths from All Causes in 2022.
845 more deaths from All Causes (2015-2022)
To show this year’s deaths from All Causes are up 18% compared to Old Normal rates, we need to calculate the rates for both 2022 and for the Old Normal.
Remember, death rates are calculated to answer these questions:
“How many people aged 45-49 were there?” and
“How many of them died from All Causes?”
The following 2 charts provide this information:
Deaths – All Causes – Male – Aged 45-49 | Alabama, United-states
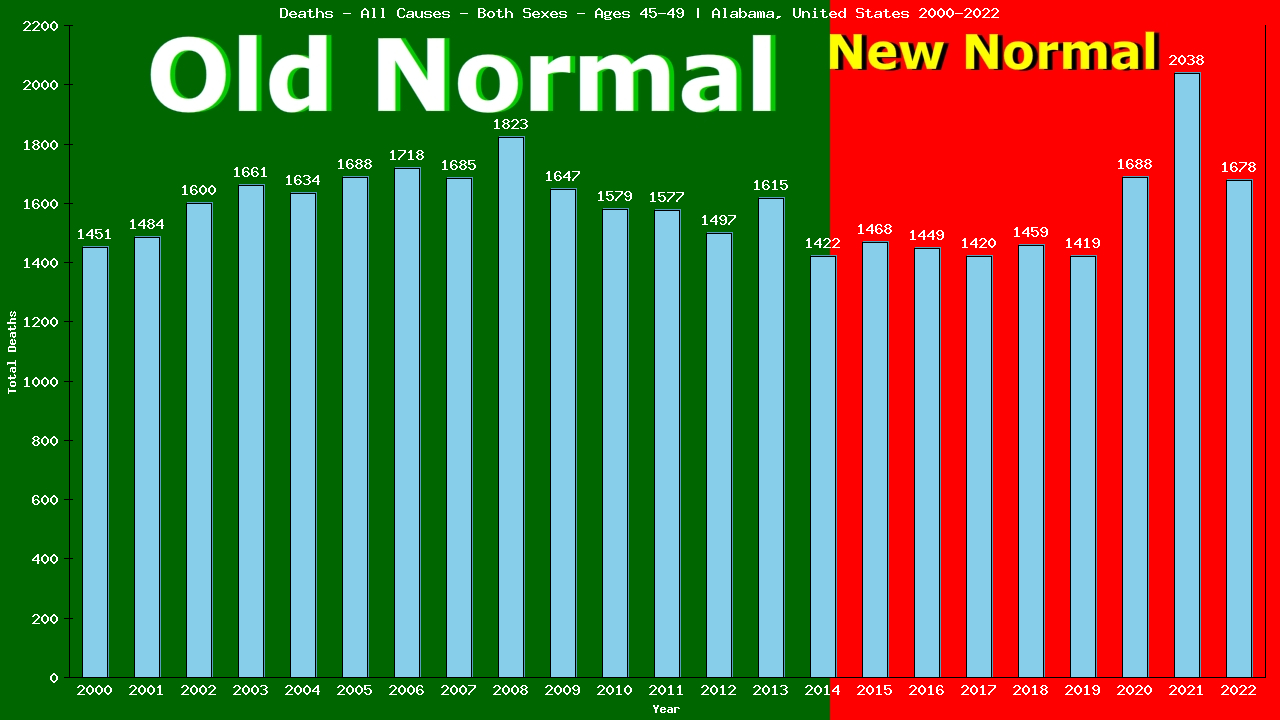
From the charts, we can see that in 2022, 1,678 of 296,419 people aged 45-49 living in Alabama died from All Causes.
1,678 ÷ 296,419 = 0.00566 (2022 CDR)
We’ll use the table below to calculate our Old Normal rate for deaths from All Causes
Old Normal (2001-2014) Alabama male aged 45-49 All Causes
Year
Pop
Died
From
|2000
315,173
1,451
1,451
|2001
323,347
1,484
1,484
|2002
330,998
1,600
1,600
|2003
337,237
1,661
1,661
|2004
340,768
1,634
1,634
|Year
Pop
Died
From
|2005
344,392
1,688
1,688
|2006
348,601
1,718
1,718
|2007
348,251
1,685
1,685
|2008
348,148
1,823
1,823
|2009
348,256
1,647
1,647
|Year
Pop
Died
From
|2010
346,369
1,579
1,579
|2011
336,400
1,577
1,577
|2012
326,840
1,497
1,497
|2013
318,601
1,615
1,615
|2014
311,838
1,422
1,422
Cumulative:
Population
Deaths
All Causes
Totals:
5,025,219
24,081
24,081
The table shows there were a total of 24,081 deaths from All Causes among 5,025,219 people aged 45-49 living in Alabama in the 15 years immediately prior to the New Normal™.
24,081 ÷ 5,025,219 = 0.00479 (Old Normal CDR)
We can use the Old Normal rate to predict this year’s deaths:
2022 pop X Old Normal CDR = expected deaths
296,419 X 0.00479 = 1,420 expected deaths
The difference between actual and expected deaths shows lives saved or lost:
1,678 – 1,420 = 258
Dividing the actual deaths by the expected deaths gives us the comparative rates:
1,678 ÷ 1,420 = 1.1789
This reveals 258 lives lost and is 117.89% of what we expected (an increase of 18%) in deaths from All Causes among people aged 45-49 living in Alabama in 2022, as compared to the Old Normal.
Compare our Old Normal to the 5yr CDR. Does it tell the same story your TV does?
5yr CDR (2017-2021)
Year
Pop
Died
From
|2017
313,756
1,420
1,420
|2018
312,966
1,459
1,459
|2019
308,951
1,419
1,419
|2020
302,481
1,688
1,688
|2021
301,395
2,038
2,038
Total:
2,160,653
10,941
10,941
This is the same method used by Public Health to calculate the 5-yr CDR (Cumulative Death Rate):
10,941 ÷ 2,160,653 = 0.00506 (5-yr CDR)
296,419(2022 pop) X 0.00506 = 1,501 expected deaths
The difference between actual and expected deaths:
1,678 – 1,501 = 177 or 177 lives lost
Divide actual deaths by expected deaths:
1,678 ÷ 1,501 = 1.1157 or an increase of 12%
for deaths from All Causes among people aged 45-49 living in Alabama in 2022, as compared to the previous 5 years.
Finally, the same method can also be used to compare our Old Normal rate to the New Normal™ rate:
New Normal™ population X Old Normal rate = expected deaths
2,457,072 X 0.00479 = 11,774 expected deaths
The difference between actual and expected deaths:
12619 – 11,774 = 845 or 845 lives lost
Dividing the actual deaths by the expected deaths:
12,619 ÷ 11,774 = 1.0695 or an increase of 7%
in deaths from All Causes among people aged 45-49 living in Alabama in the New Normal™, as compared to the Old Normal.
New Normal (2015-2022)
Year
Pop
Died
From
|2015
309,049
1,468
1,468
|2016
312,055
1,449
1,449
|2017
313,756
1,420
1,420
|2018
312,966
1,459
1,459
|2019
308,951
1,419
1,419
|2020
302,481
1,688
1,688
|2021
301,395
2,038
2,038
|2022
296,419
1,678
1,678
Total:
2,457,072
12,619
12,619
The world has been led to believe that a deadly pandemic swept the globe beginning in 2020, causing an increase in death rates, especially among the elderly
The data show that death rates began to increase in 2015, immediately upon implementation of the UN’s 2030 Agenda for Sustainable Development, that young adults have experienced ever-increasing death rates since, and that death rates among the elderly have remained relatively stable.
Browse through the age-categorized charts below to see the evidence of this. Click on any chart to see the full analysis for each age group.
62,294 of the 62,294 deaths among individuals of all ages living in Alabama in 2022 were from All Causes (100.00% of all deaths).
This is up 21% compared to Old Normal (2000-2014) rates which, when applied to the this year's both sexes population of 4,980,925 individuals would have predicted 51,536 deaths from All Causes.
This means there were 10,758 more deaths than expected from All Causes among individuals of all ages living in Alabama in 2022.
To date, 61,512 individual lives have been lost to All Causes over the first 8 years of Alabama's New Normal™.
Browse through the age categories below to learn how these deaths from All Causes in 2022 are distributed among each age group of individuals in Alabama.
Click the bar graph above to see how both the 2022 loss of 10,758 lives and the 8-year loss of 61,512 individual lives from All Causes is arrived at.
The first 386 of the 62,294 deaths from All Causes in 2022 were among babies in their first year of life, accounting for 100.00% of the 386 total deaths in this group.
This is down 27% compared to Old Normal rates which, when applied to this year's population of 57,882 babies in their first year of life, would have predicted 526 deaths from All Causes this year.
This means there were 140 fewer deaths than expected from All Causes among babies in their first year of life living in Alabama in 2022.
Overall, 3,554 deaths from All Causes represent 607 lives saved among babies in their first year of life over the first 8 years of Alabama's New Normal™.
Click the bar graph above to see how both the 2022 total of 140 fewer live lost than expected and the 8 year total of 3554 lives saved from All Causes among babies in their first year of life is arrived at.
Yearly All Causes Tally: 386 / 62,294
The next 104 of the 62,294 individual deaths from All Causes in 2022 were among pre-schoolers aged 1-4, accounting for 99.99% of the 104 total deaths in this group.
This is up 13% compared to Old Normal rates. Those rates, applied to this year's population of 232,417 pre-schoolers aged 1-4, would have predicted 90 deaths from All Causes this year.
This means there were 14 more deaths than expected from All Causes among pre-schoolers aged 1-4 living in Alabama in 2022.
Overall, 739 deaths from All Causes represent 10 lives lost among pre-schoolers aged 1-4 over the first 8 years of Alabama's New Normal™.
Click the bar graph above to see how the both the 2022 total of 14 more and the 8 year total of 739 more individual aged 1-4 deaths from All Causes is arrived at.
Yearly All Causes Tally: 490 / 62,294
The next 60 of the 62,294 individual deaths from All Causes in 2022 were among children aged 5-9, accounting for 99.98% of the 60 total deaths in this group.
This is up 1% compared to Old Normal rates. Those rates, applied to this year's population of 305,273 children aged 5-9, would have predicted 57 deaths from All Causes this year.
This means there were 3 more deaths than expected from All Causes among children aged 5-9 living in Alabama in 2022.
Overall, 414 deaths from All Causes represent 40 lives saved among children aged 5-9 over the first 8 years of Alabama's New Normal™.
Click the bar graph above to see how the both the 2022 total of 3 more and the 8 year total of 414 more individual aged 5-9 deaths from All Causes is arrived at.
Yearly All Causes Tally: 550 / 62,294
The next 69 of the 62,294 individual deaths from All Causes in 2022 were among children aged 10-14, accounting for 99.99% of the 69 total deaths in this group.
This is down 8% compared to Old Normal rates. Those rates, applied to this year's population of 318,447 children aged 10-14, would have predicted 72 deaths from All Causes this year.
This means there were 3 fewer deaths than expected from All Causes among children aged 10-14 living in Alabama in 2022.
Overall, 512 deaths from All Causes represent 51 lives saved among children aged 10-14 over the first 8 years of Alabama's New Normal™.
Click the bar graph above to see how the both the 2022 total of 3 fewer and the 8 year total of 512 fewer individual aged 10-14 deaths from All Causes is arrived at.
Yearly All Causes Tally: 619 / 62,294
The next 226 of the 62,294 individual deaths from All Causes in 2022 were among teens aged 15-19, accounting for 100.00% of the 226 total deaths in this group.
This is down 17% compared to Old Normal rates. Those rates, applied to this year's population of 334,114 teens aged 15-19, would have predicted 268 deaths from All Causes this year.
This means there were 42 fewer deaths than expected from All Causes among teens aged 15-19 living in Alabama in 2022.
Overall, 1,939 deaths from All Causes represent 113 lives saved among teens aged 15-19 over the first 8 years of Alabama's New Normal™.
Click the bar graph above to see how the both the 2022 total of 42 fewer and the 8 year total of 1,939 fewer individual aged 15-19 deaths from All Causes is arrived at.
Yearly All Causes Tally: 845 / 62,294
The next 499 of the 62,294 individual deaths from All Causes in 2022 were among people aged 20-24, accounting for 100.00% of the 499 total deaths in this group.
This is up 8% compared to Old Normal rates. Those rates, applied to this year's population of 355,450 people aged 20-24, would have predicted 460 deaths from All Causes this year.
This means there were 39 more deaths than expected from All Causes among people aged 20-24 living in Alabama in 2022.
Overall, 3,642 deaths from All Causes represent 195 lives lost among people aged 20-24 over the first 8 years of Alabama's New Normal™.
Click the bar graph above to see how the both the 2022 total of 39 more and the 8 year total of 3,642 more individual aged 20-24 deaths from All Causes is arrived at.
Yearly All Causes Tally: 1,344 / 62,294
The next 631 of the 62,294 individual deaths from All Causes in 2022 were among people aged 25-29, accounting for 100.00% of the 631 total deaths in this group.
This is up 33% compared to Old Normal rates. Those rates, applied to this year's population of 321,108 people aged 25-29, would have predicted 470 deaths from All Causes this year.
This means there were 161 more deaths than expected from All Causes among people aged 25-29 living in Alabama in 2022.
Overall, 4,566 deaths from All Causes represent 688 lives lost among people aged 25-29 over the first 8 years of Alabama's New Normal™.
Click the bar graph above to see how the both the 2022 total of 161 more and the 8 year total of 4,566 more individual aged 25-29 deaths from All Causes is arrived at.
Yearly All Causes Tally: 1,975 / 62,294
The next 870 of the 62,294 individual deaths from All Causes in 2022 were among people aged 30-34, accounting for 100.00% of the 870 total deaths in this group.
This is up 48% compared to Old Normal rates. Those rates, applied to this year's population of 336,797 people aged 30-34, would have predicted 583 deaths from All Causes this year.
This means there were 287 more deaths than expected from All Causes among people aged 30-34 living in Alabama in 2022.
Overall, 5,720 deaths from All Causes represent 1,366 lives lost among people aged 30-34 over the first 8 years of Alabama's New Normal™.
Click the bar graph above to see how the both the 2022 total of 287 more and the 8 year total of 5,720 more individual aged 30-34 deaths from All Causes is arrived at.
Yearly All Causes Tally: 2,845 / 62,294
The next 985 of the 62,294 individual deaths from All Causes in 2022 were among people aged 35-39, accounting for 100.00% of the 985 total deaths in this group.
This is up 39% compared to Old Normal rates. Those rates, applied to this year's population of 311,105 people aged 35-39, would have predicted 703 deaths from All Causes this year.
This means there were 282 more deaths than expected from All Causes among people aged 35-39 living in Alabama in 2022.
Overall, 7,042 deaths from All Causes represent 1,536 lives lost among people aged 35-39 over the first 8 years of Alabama's New Normal™.
Click the bar graph above to see how the both the 2022 total of 282 more and the 8 year total of 7,042 more individual aged 35-39 deaths from All Causes is arrived at.
Yearly All Causes Tally: 3,830 / 62,294
The next 1,308 of the 62,294 individual deaths from All Causes in 2022 were among people aged 40-44, accounting for 100.00% of the 1,308 total deaths in this group.
This is up 30% compared to Old Normal rates. Those rates, applied to this year's population of 310,743 people aged 40-44, would have predicted 1,001 deaths from All Causes this year.
This means there were 307 more deaths than expected from All Causes among people aged 40-44 living in Alabama in 2022.
Overall, 9,128 deaths from All Causes represent 1,458 lives lost among people aged 40-44 over the first 8 years of Alabama's New Normal™.
Click the bar graph above to see how the both the 2022 total of 307 more and the 8 year total of 9,128 more individual aged 40-44 deaths from All Causes is arrived at.
Yearly All Causes Tally: 5,138 / 62,294
The next 1,678 of the 62,294 individual deaths from All Causes in 2022 were among people aged 45-49, accounting for 100.00% of the 1,678 total deaths in this group.
This is up 18% compared to Old Normal rates. Those rates, applied to this year's population of 296,419 people aged 45-49, would have predicted 1,420 deaths from All Causes this year.
This means there were 258 more deaths than expected from All Causes among people aged 45-49 living in Alabama in 2022.
Overall, 12,619 deaths from All Causes represent 845 lives lost among people aged 45-49 over the first 8 years of Alabama's New Normal™.
Click the bar graph above to see how the both the 2022 total of 258 more and the 8 year total of 12,619 more individual aged 45-49 deaths from All Causes is arrived at.
Yearly All Causes Tally: 6,816 / 62,294
The next 2,410 of the 62,294 individual deaths from All Causes in 2022 were among people aged 50-54, accounting for 100.00% of the 2,410 total deaths in this group.
This is up 8% compared to Old Normal rates. Those rates, applied to this year's population of 321,378 people aged 50-54, would have predicted 2,219 deaths from All Causes this year.
This means there were 191 more deaths than expected from All Causes among people aged 50-54 living in Alabama in 2022.
Overall, 19,143 deaths from All Causes represent 1,428 lives lost among people aged 50-54 over the first 8 years of Alabama's New Normal™.
Click the bar graph above to see how the both the 2022 total of 191 more and the 8 year total of 19,143 more individual aged 50-54 deaths from All Causes is arrived at.
Yearly All Causes Tally: 9,226 / 62,294
The next 3,617 of the 62,294 individual deaths from All Causes in 2022 were among people aged 55-59, accounting for 100.00% of the 3,617 total deaths in this group.
This is up 12% compared to Old Normal rates. Those rates, applied to this year's population of 325,873 people aged 55-59, would have predicted 3,231 deaths from All Causes this year.
This means there were 386 more deaths than expected from All Causes among people aged 55-59 living in Alabama in 2022.
Overall, 29,283 deaths from All Causes represent 2,690 lives lost among people aged 55-59 over the first 8 years of Alabama's New Normal™.
Click the bar graph above to see how the both the 2022 total of 386 more and the 8 year total of 29,283 more individual aged 55-59 deaths from All Causes is arrived at.
Yearly All Causes Tally: 12,843 / 62,294
The next 5,386 of the 62,294 individual deaths from All Causes in 2022 were among people aged 60-64, accounting for 100.00% of the 5,386 total deaths in this group.
This is up 15% compared to Old Normal rates. Those rates, applied to this year's population of 332,557 people aged 60-64, would have predicted 4,675 deaths from All Causes this year.
This means there were 711 more deaths than expected from All Causes among people aged 60-64 living in Alabama in 2022.
Overall, 39,762 deaths from All Causes represent 3,880 lives lost among people aged 60-64 over the first 8 years of Alabama's New Normal™.
Click the bar graph above to see how the both the 2022 total of 711 more and the 8 year total of 39,762 more individual aged 60-64 deaths from All Causes is arrived at.
Yearly All Causes Tally: 18,229 / 62,294
The next 6,417 of the 62,294 individual deaths from All Causes in 2022 were among elderly men and women aged 65-69, accounting for 100.00% of the 6,417 total deaths in this group.
This is up 5% compared to Old Normal rates. Those rates, applied to this year's population of 297,711 elderly men and women aged 65-69, would have predicted 6,095 deaths from All Causes this year.
This means there were 322 more deaths than expected from All Causes among elderly men and women aged 65-69 living in Alabama in 2022.
Overall, 46,588 deaths from All Causes represent 1,113 lives lost among elderly men and women aged 65-69 over the first 8 years of Alabama's New Normal™.
Click the bar graph above to see how the both the 2022 total of 322 more and the 8 year total of 46,588 more individual aged 65-69 deaths from All Causes is arrived at.
Yearly All Causes Tally: 24,646 / 62,294
The next 7,544 of the 62,294 individual deaths from All Causes in 2022 were among elderly men and women aged 70-74, accounting for 100.00% of the 7,544 total deaths in this group.
This is up 1% compared to Old Normal rates. Those rates, applied to this year's population of 243,171 elderly men and women aged 70-74, would have predicted 7,457 deaths from All Causes this year.
This means there were 87 more deaths than expected from All Causes among elderly men and women aged 70-74 living in Alabama in 2022.
Overall, 53,631 deaths from All Causes represent 362 lives saved among elderly men and women aged 70-74 over the first 8 years of Alabama's New Normal™.
Click the bar graph above to see how the both the 2022 total of 87 more and the 8 year total of 53,631 more individual aged 70-74 deaths from All Causes is arrived at.
Yearly All Causes Tally: 32,190 / 62,294
The next 8,199 of the 62,294 individual deaths from All Causes in 2022 were among elderly men and women aged 75-79, accounting for 100.00% of the 8,199 total deaths in this group.
This is down 2% compared to Old Normal rates. Those rates, applied to this year's population of 174,946 elderly men and women aged 75-79, would have predicted 8,327 deaths from All Causes this year.
This means there were 128 fewer deaths than expected from All Causes among elderly men and women aged 75-79 living in Alabama in 2022.
Overall, 56,088 deaths from All Causes represent 2,003 lives saved among elderly men and women aged 75-79 over the first 8 years of Alabama's New Normal™.
Click the bar graph above to see how the both the 2022 total of 128 fewer and the 8 year total of 56,088 fewer individual aged 75-79 deaths from All Causes is arrived at.
Yearly All Causes Tally: 40,389 / 62,294
The next 7,847 of the 62,294 individual deaths from All Causes in 2022 were among elderly men and women aged 80-84, accounting for 100.00% of the 7,847 total deaths in this group.
This is down 3% compared to Old Normal rates. Those rates, applied to this year's population of 105,534 elderly men and women aged 80-84, would have predicted 8,110 deaths from All Causes this year.
This means there were 263 fewer deaths than expected from All Causes among elderly men and women aged 80-84 living in Alabama in 2022.
Overall, 58,362 deaths from All Causes represent 2,453 lives saved among elderly men and women aged 80-84 over the first 8 years of Alabama's New Normal™.
Click the bar graph above to see how the both the 2022 total of 263 fewer and the 8 year total of 58,362 fewer individual aged 80-84 deaths from All Causes is arrived at.
Yearly All Causes Tally: 48,236 / 62,294
The next 21,905 of the 62,294 deaths from All Causes in 2022 were among elderly men and women aged 80+, accounting for 100.00% of the 21,905 total deaths in this group.
This is down 3% compared to Old Normal rates which, when applied to this year's population of 105,534 would have predicted 22,533 deaths from All Causes this year.
This means there were 628 fewer deaths than expected from All Causes among elderly men and women aged 80+ living in Alabama in 2022.
Overall, 167,664 deaths from All Causes represent 1,303 lives saved among elderly men and women aged 80+ over the first 8 years of Alabama's New Normal™.
Click the bar graph above to see how the 8 year total of 167,664 excess individual deaths from All Causes is arrived at.
Yearly All Causes Tally: 70,141 / 62,294*
* Alabama does not report the deaths of 7,847 babies in it's death totals