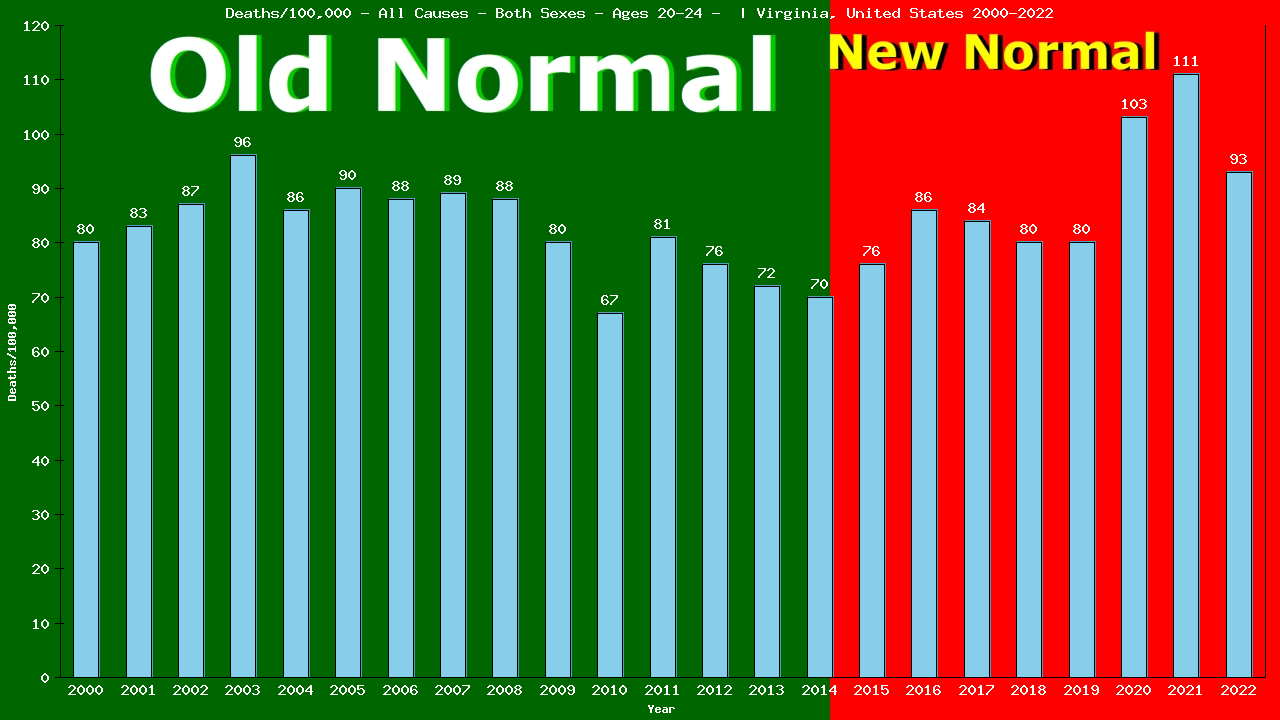
2022 vs New Normal™ for people aged 20-24 in Virginia
559 of 559 total deaths were from All Causes
100.00% of all deaths were from All Causes
This is up 12% compared to Old Normal rates.
491 of 491 total deaths would have been expected under Old Normal conditions.
68 more deaths from All Causes in 2022.
331 more deaths from All Causes (2015-2022)
To show this year’s deaths from All Causes are up 12% compared to Old Normal rates, we need to calculate the rates for both 2022 and for the Old Normal.
Remember, death rates are calculated to answer these questions:
“How many people aged 20-24 were there?” and
“How many of them died from All Causes?”
The following 2 charts provide this information:
Deaths – All Causes – Male – Aged 20-24 | Virginia, United-states
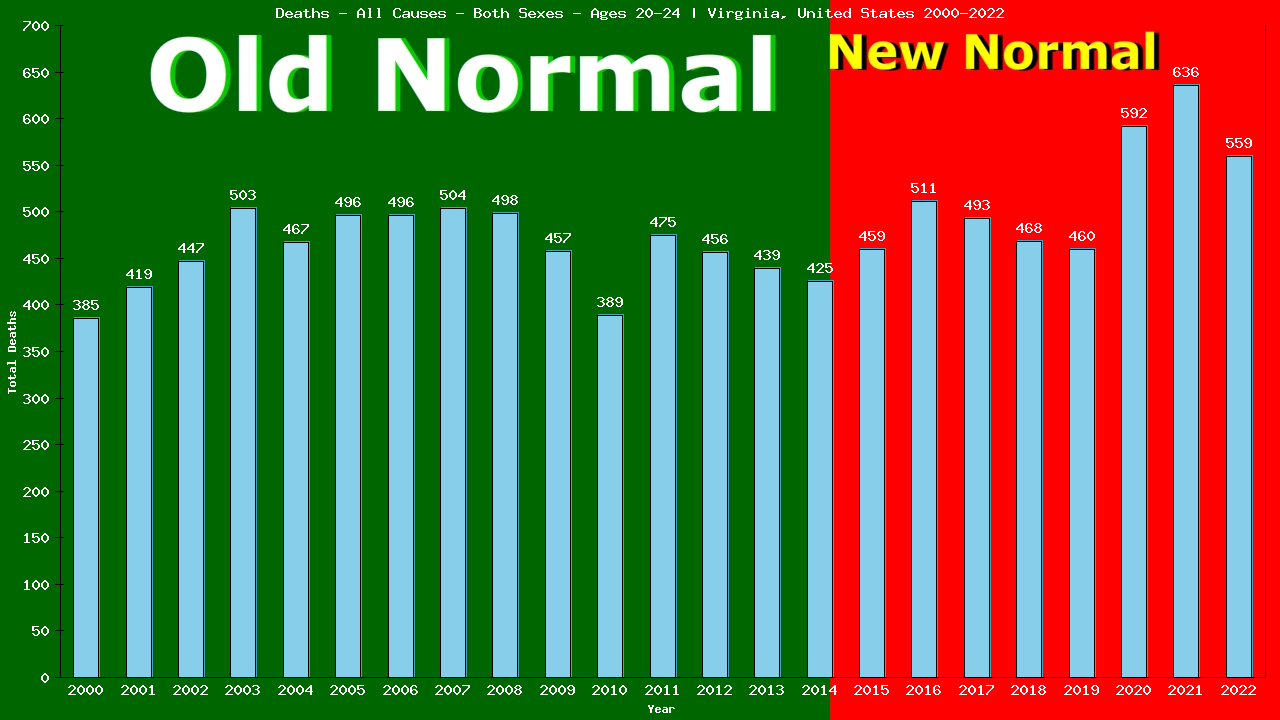
From the charts, we can see that in 2022, 559 of 595,826 people aged 20-24 living in Virginia died from All Causes.
559 ÷ 595,826 = 0.00094 (2022 CDR)
We’ll use the table below to calculate our Old Normal rate for deaths from All Causes
Old Normal (2001-2014) Virginia male aged 20-24 All Causes
Year
Pop
Died
From
|2000
480,574
385
385
|2001
500,413
419
419
|2002
509,537
447
447
|2003
523,301
503
503
|2004
537,407
467
467
|Year
Pop
Died
From
|2005
550,708
496
496
|2006
561,301
496
496
|2007
564,400
504
504
|2008
563,806
498
498
|2009
568,171
457
457
|Year
Pop
Died
From
|2010
572,091
389
389
|2011
584,194
475
475
|2012
592,854
456
456
|2013
601,525
439
439
|2014
604,507
425
425
Cumulative:
Population
Deaths
All Causes
Totals:
8,314,789
6,856
6,856
The table shows there were a total of 6,856 deaths from All Causes among 8,314,789 people aged 20-24 living in Virginia in the 15 years immediately prior to the New Normal™.
6,856 ÷ 8,314,789 = 0.00082 (Old Normal CDR)
We can use the Old Normal rate to predict this year’s deaths:
2022 pop X Old Normal CDR = expected deaths
595,826 X 0.00082 = 491 expected deaths
The difference between actual and expected deaths shows lives saved or lost:
559 – 491 = 68
Dividing the actual deaths by the expected deaths gives us the comparative rates:
559 ÷ 491 = 1.1242
This reveals 68 lives lost and is 112.42% of what we expected (an increase of 12%) in deaths from All Causes among people aged 20-24 living in Virginia in 2022, as compared to the Old Normal.
Compare our Old Normal to the 5yr CDR. Does it tell the same story your TV does?
5yr CDR (2017-2021)
Year
Pop
Died
From
|2017
582,807
493
493
|2018
578,812
468
468
|2019
571,619
460
460
|2020
574,562
592
592
|2021
572,429
636
636
Total:
4,070,077
3,619
3,619
This is the same method used by Public Health to calculate the 5-yr CDR (Cumulative Death Rate):
3,619 ÷ 4,070,077 = 0.00089 (5-yr CDR)
595,826(2022 pop) X 0.00089 = 530 expected deaths
The difference between actual and expected deaths:
559 – 530 = 29 or 29 lives lost
Divide actual deaths by expected deaths:
559 ÷ 530 = 1.0434 or an increase of 4%
for deaths from All Causes among people aged 20-24 living in Virginia in 2022, as compared to the previous 5 years.
Finally, the same method can also be used to compare our Old Normal rate to the New Normal™ rate:
New Normal™ population X Old Normal rate = expected deaths
4,665,903 X 0.00082 = 3,847 expected deaths
The difference between actual and expected deaths:
4178 – 3,847 = 331 or 331 lives lost
Dividing the actual deaths by the expected deaths:
4,178 ÷ 3,847 = 1.0729 or an increase of 7%
in deaths from All Causes among people aged 20-24 living in Virginia in the New Normal™, as compared to the Old Normal.
New Normal (2015-2022)
Year
Pop
Died
From
|2015
600,047
459
459
|2016
589,801
511
511
|2017
582,807
493
493
|2018
578,812
468
468
|2019
571,619
460
460
|2020
574,562
592
592
|2021
572,429
636
636
|2022
595,826
559
559
Total:
4,665,903
4,178
4,178
The world has been led to believe that a deadly pandemic swept the globe beginning in 2020, causing an increase in death rates, especially among the elderly
The data show that death rates began to increase in 2015, immediately upon implementation of the UN’s 2030 Agenda for Sustainable Development, that young adults have experienced ever-increasing death rates since, and that death rates among the elderly have remained relatively stable.
Browse through the age-categorized charts below to see the evidence of this. Click on any chart to see the full analysis for each age group.
82,935 of the 82,935 deaths among individuals of all ages living in Virginia in 2022 were from All Causes (100.00% of all deaths).
This is up 26% compared to Old Normal (2000-2014) rates which, when applied to the this year's both sexes population of 8,526,761 individuals would have predicted 65,886 deaths from All Causes.
This means there were 17,049 more deaths than expected from All Causes among individuals of all ages living in Virginia in 2022.
To date, 71,777 individual lives have been lost to All Causes over the first 8 years of Virginia's New Normal™.
Browse through the age categories below to learn how these deaths from All Causes in 2022 are distributed among each age group of individuals in Virginia.
Click the bar graph above to see how both the 2022 loss of 17,049 lives and the 8-year loss of 71,777 individual lives from All Causes is arrived at.
The first 586 of the 82,935 deaths from All Causes in 2022 were among babies in their first year of life, accounting for 100.00% of the 586 total deaths in this group.
This is down 16% compared to Old Normal rates which, when applied to this year's population of 96,728 babies in their first year of life, would have predicted 698 deaths from All Causes this year.
This means there were 112 fewer deaths than expected from All Causes among babies in their first year of life living in Virginia in 2022.
Overall, 4,623 deaths from All Causes represent 1,075 lives saved among babies in their first year of life over the first 8 years of Virginia's New Normal™.
Click the bar graph above to see how both the 2022 total of 112 fewer live lost than expected and the 8 year total of 4623 lives saved from All Causes among babies in their first year of life is arrived at.
Yearly All Causes Tally: 586 / 82,935
The next 97 of the 82,935 individual deaths from All Causes in 2022 were among pre-schoolers aged 1-4, accounting for 99.99% of the 97 total deaths in this group.
This is down 6% compared to Old Normal rates. Those rates, applied to this year's population of 390,765 pre-schoolers aged 1-4, would have predicted 100 deaths from All Causes this year.
This means there were 3 fewer deaths than expected from All Causes among pre-schoolers aged 1-4 living in Virginia in 2022.
Overall, 737 deaths from All Causes represent 92 lives saved among pre-schoolers aged 1-4 over the first 8 years of Virginia's New Normal™.
Click the bar graph above to see how the both the 2022 total of 3 fewer and the 8 year total of 737 fewer individual aged 1-4 deaths from All Causes is arrived at.
Yearly All Causes Tally: 683 / 82,935
The next 74 of the 82,935 individual deaths from All Causes in 2022 were among children aged 5-9, accounting for 99.99% of the 74 total deaths in this group.
This is up 8% compared to Old Normal rates. Those rates, applied to this year's population of 515,804 children aged 5-9, would have predicted 63 deaths from All Causes this year.
This means there were 11 more deaths than expected from All Causes among children aged 5-9 living in Virginia in 2022.
Overall, 456 deaths from All Causes represent 52 lives saved among children aged 5-9 over the first 8 years of Virginia's New Normal™.
Click the bar graph above to see how the both the 2022 total of 11 more and the 8 year total of 456 more individual aged 5-9 deaths from All Causes is arrived at.
Yearly All Causes Tally: 757 / 82,935
The next 83 of the 82,935 individual deaths from All Causes in 2022 were among children aged 10-14, accounting for 99.99% of the 83 total deaths in this group.
This is up 1% compared to Old Normal rates. Those rates, applied to this year's population of 533,136 children aged 10-14, would have predicted 79 deaths from All Causes this year.
This means there were 4 more deaths than expected from All Causes among children aged 10-14 living in Virginia in 2022.
Overall, 587 deaths from All Causes represent 38 lives saved among children aged 10-14 over the first 8 years of Virginia's New Normal™.
Click the bar graph above to see how the both the 2022 total of 4 more and the 8 year total of 587 more individual aged 10-14 deaths from All Causes is arrived at.
Yearly All Causes Tally: 840 / 82,935
The next 347 of the 82,935 individual deaths from All Causes in 2022 were among teens aged 15-19, accounting for 100.00% of the 347 total deaths in this group.
This is up 17% compared to Old Normal rates. Those rates, applied to this year's population of 557,946 teens aged 15-19, would have predicted 292 deaths from All Causes this year.
This means there were 55 more deaths than expected from All Causes among teens aged 15-19 living in Virginia in 2022.
Overall, 2,207 deaths from All Causes represent 73 lives saved among teens aged 15-19 over the first 8 years of Virginia's New Normal™.
Click the bar graph above to see how the both the 2022 total of 55 more and the 8 year total of 2,207 more individual aged 15-19 deaths from All Causes is arrived at.
Yearly All Causes Tally: 1,187 / 82,935
The next 559 of the 82,935 individual deaths from All Causes in 2022 were among people aged 20-24, accounting for 100.00% of the 559 total deaths in this group.
This is up 12% compared to Old Normal rates. Those rates, applied to this year's population of 595,826 people aged 20-24, would have predicted 491 deaths from All Causes this year.
This means there were 68 more deaths than expected from All Causes among people aged 20-24 living in Virginia in 2022.
Overall, 4,178 deaths from All Causes represent 331 lives lost among people aged 20-24 over the first 8 years of Virginia's New Normal™.
Click the bar graph above to see how the both the 2022 total of 68 more and the 8 year total of 4,178 more individual aged 20-24 deaths from All Causes is arrived at.
Yearly All Causes Tally: 1,746 / 82,935
The next 767 of the 82,935 individual deaths from All Causes in 2022 were among people aged 25-29, accounting for 100.00% of the 767 total deaths in this group.
This is up 52% compared to Old Normal rates. Those rates, applied to this year's population of 575,734 people aged 25-29, would have predicted 499 deaths from All Causes this year.
This means there were 268 more deaths than expected from All Causes among people aged 25-29 living in Virginia in 2022.
Overall, 5,438 deaths from All Causes represent 1,322 lives lost among people aged 25-29 over the first 8 years of Virginia's New Normal™.
Click the bar graph above to see how the both the 2022 total of 268 more and the 8 year total of 5,438 more individual aged 25-29 deaths from All Causes is arrived at.
Yearly All Causes Tally: 2,513 / 82,935
The next 1,061 of the 82,935 individual deaths from All Causes in 2022 were among people aged 30-34, accounting for 100.00% of the 1,061 total deaths in this group.
This is up 82% compared to Old Normal rates. Those rates, applied to this year's population of 598,752 people aged 30-34, would have predicted 577 deaths from All Causes this year.
This means there were 484 more deaths than expected from All Causes among people aged 30-34 living in Virginia in 2022.
Overall, 6,596 deaths from All Causes represent 2,050 lives lost among people aged 30-34 over the first 8 years of Virginia's New Normal™.
Click the bar graph above to see how the both the 2022 total of 484 more and the 8 year total of 6,596 more individual aged 30-34 deaths from All Causes is arrived at.
Yearly All Causes Tally: 3,574 / 82,935
The next 1,207 of the 82,935 individual deaths from All Causes in 2022 were among people aged 35-39, accounting for 100.00% of the 1,207 total deaths in this group.
This is up 52% compared to Old Normal rates. Those rates, applied to this year's population of 594,771 people aged 35-39, would have predicted 790 deaths from All Causes this year.
This means there were 417 more deaths than expected from All Causes among people aged 35-39 living in Virginia in 2022.
Overall, 7,791 deaths from All Causes represent 1,667 lives lost among people aged 35-39 over the first 8 years of Virginia's New Normal™.
Click the bar graph above to see how the both the 2022 total of 417 more and the 8 year total of 7,791 more individual aged 35-39 deaths from All Causes is arrived at.
Yearly All Causes Tally: 4,781 / 82,935
The next 1,436 of the 82,935 individual deaths from All Causes in 2022 were among people aged 40-44, accounting for 100.00% of the 1,436 total deaths in this group.
This is up 24% compared to Old Normal rates. Those rates, applied to this year's population of 573,168 people aged 40-44, would have predicted 1,149 deaths from All Causes this year.
This means there were 287 more deaths than expected from All Causes among people aged 40-44 living in Virginia in 2022.
Overall, 9,385 deaths from All Causes represent 704 lives lost among people aged 40-44 over the first 8 years of Virginia's New Normal™.
Click the bar graph above to see how the both the 2022 total of 287 more and the 8 year total of 9,385 more individual aged 40-44 deaths from All Causes is arrived at.
Yearly All Causes Tally: 6,217 / 82,935
The next 1,750 of the 82,935 individual deaths from All Causes in 2022 were among people aged 45-49, accounting for 100.00% of the 1,750 total deaths in this group.
This is up 9% compared to Old Normal rates. Those rates, applied to this year's population of 520,947 people aged 45-49, would have predicted 1,598 deaths from All Causes this year.
This means there were 152 more deaths than expected from All Causes among people aged 45-49 living in Virginia in 2022.
Overall, 13,149 deaths from All Causes represent 298 lives saved among people aged 45-49 over the first 8 years of Virginia's New Normal™.
Click the bar graph above to see how the both the 2022 total of 152 more and the 8 year total of 13,149 more individual aged 45-49 deaths from All Causes is arrived at.
Yearly All Causes Tally: 7,967 / 82,935
The next 2,758 of the 82,935 individual deaths from All Causes in 2022 were among people aged 50-54, accounting for 100.00% of the 2,758 total deaths in this group.
This is up 6% compared to Old Normal rates. Those rates, applied to this year's population of 554,957 people aged 50-54, would have predicted 2,593 deaths from All Causes this year.
This means there were 165 more deaths than expected from All Causes among people aged 50-54 living in Virginia in 2022.
Overall, 21,532 deaths from All Causes represent 194 lives lost among people aged 50-54 over the first 8 years of Virginia's New Normal™.
Click the bar graph above to see how the both the 2022 total of 165 more and the 8 year total of 21,532 more individual aged 50-54 deaths from All Causes is arrived at.
Yearly All Causes Tally: 10,725 / 82,935
The next 4,294 of the 82,935 individual deaths from All Causes in 2022 were among people aged 55-59, accounting for 100.00% of the 4,294 total deaths in this group.
This is up 11% compared to Old Normal rates. Those rates, applied to this year's population of 561,842 people aged 55-59, would have predicted 3,870 deaths from All Causes this year.
This means there were 424 more deaths than expected from All Causes among people aged 55-59 living in Virginia in 2022.
Overall, 33,808 deaths from All Causes represent 1,974 lives lost among people aged 55-59 over the first 8 years of Virginia's New Normal™.
Click the bar graph above to see how the both the 2022 total of 424 more and the 8 year total of 33,808 more individual aged 55-59 deaths from All Causes is arrived at.
Yearly All Causes Tally: 15,019 / 82,935
The next 6,253 of the 82,935 individual deaths from All Causes in 2022 were among people aged 60-64, accounting for 100.00% of the 6,253 total deaths in this group.
This is up 9% compared to Old Normal rates. Those rates, applied to this year's population of 548,255 people aged 60-64, would have predicted 5,713 deaths from All Causes this year.
This means there were 540 more deaths than expected from All Causes among people aged 60-64 living in Virginia in 2022.
Overall, 45,116 deaths from All Causes represent 1,447 lives lost among people aged 60-64 over the first 8 years of Virginia's New Normal™.
Click the bar graph above to see how the both the 2022 total of 540 more and the 8 year total of 45,116 more individual aged 60-64 deaths from All Causes is arrived at.
Yearly All Causes Tally: 21,272 / 82,935
The next 7,823 of the 82,935 individual deaths from All Causes in 2022 were among elderly men and women aged 65-69, accounting for 100.00% of the 7,823 total deaths in this group.
This is up 2% compared to Old Normal rates. Those rates, applied to this year's population of 472,272 elderly men and women aged 65-69, would have predicted 7,636 deaths from All Causes this year.
This means there were 187 more deaths than expected from All Causes among elderly men and women aged 65-69 living in Virginia in 2022.
Overall, 53,832 deaths from All Causes represent 3,326 lives saved among elderly men and women aged 65-69 over the first 8 years of Virginia's New Normal™.
Click the bar graph above to see how the both the 2022 total of 187 more and the 8 year total of 53,832 more individual aged 65-69 deaths from All Causes is arrived at.
Yearly All Causes Tally: 29,095 / 82,935
The next 9,190 of the 82,935 individual deaths from All Causes in 2022 were among elderly men and women aged 70-74, accounting for 100.00% of the 9,190 total deaths in this group.
This is down 8% compared to Old Normal rates. Those rates, applied to this year's population of 385,817 elderly men and women aged 70-74, would have predicted 9,958 deaths from All Causes this year.
This means there were 768 fewer deaths than expected from All Causes among elderly men and women aged 70-74 living in Virginia in 2022.
Overall, 63,318 deaths from All Causes represent 8,608 lives saved among elderly men and women aged 70-74 over the first 8 years of Virginia's New Normal™.
Click the bar graph above to see how the both the 2022 total of 768 fewer and the 8 year total of 63,318 fewer individual aged 70-74 deaths from All Causes is arrived at.
Yearly All Causes Tally: 38,285 / 82,935
The next 10,665 of the 82,935 individual deaths from All Causes in 2022 were among elderly men and women aged 75-79, accounting for 100.00% of the 10,665 total deaths in this group.
This is down 8% compared to Old Normal rates. Those rates, applied to this year's population of 281,092 elderly men and women aged 75-79, would have predicted 11,634 deaths from All Causes this year.
This means there were 969 fewer deaths than expected from All Causes among elderly men and women aged 75-79 living in Virginia in 2022.
Overall, 69,917 deaths from All Causes represent 8,866 lives saved among elderly men and women aged 75-79 over the first 8 years of Virginia's New Normal™.
Click the bar graph above to see how the both the 2022 total of 969 fewer and the 8 year total of 69,917 fewer individual aged 75-79 deaths from All Causes is arrived at.
Yearly All Causes Tally: 48,950 / 82,935
The next 10,812 of the 82,935 individual deaths from All Causes in 2022 were among elderly men and women aged 80-84, accounting for 100.00% of the 10,812 total deaths in this group.
This is down 6% compared to Old Normal rates. Those rates, applied to this year's population of 168,949 elderly men and women aged 80-84, would have predicted 11,535 deaths from All Causes this year.
This means there were 723 fewer deaths than expected from All Causes among elderly men and women aged 80-84 living in Virginia in 2022.
Overall, 75,259 deaths from All Causes represent 7,545 lives saved among elderly men and women aged 80-84 over the first 8 years of Virginia's New Normal™.
Click the bar graph above to see how the both the 2022 total of 723 fewer and the 8 year total of 75,259 fewer individual aged 80-84 deaths from All Causes is arrived at.
Yearly All Causes Tally: 59,762 / 82,935
The next 33,985 of the 82,935 deaths from All Causes in 2022 were among elderly men and women aged 80+, accounting for 100.00% of the 33,985 total deaths in this group.
This is up 1% compared to Old Normal rates which, when applied to this year's population of 168,949 would have predicted 33,496 deaths from All Causes this year.
This means there were 489 more deaths than expected from All Causes among elderly men and women aged 80+ living in Virginia in 2022.
Overall, 247,105 deaths from All Causes represent 6,660 lives lost among elderly men and women aged 80+ over the first 8 years of Virginia's New Normal™.
Click the bar graph above to see how the 8 year total of 247,105 excess individual deaths from All Causes is arrived at.
Yearly All Causes Tally: 93,747 / 82,935*
* Virginia does not report the deaths of 10,812 babies in it's death totals