Lives Saved
Lives Saved
in
2022
- Categories:
- Total (12,853)

- Deaths: Government of Canada
- Population: Government of Canada
Quick Links
- There were a total of 334,081 deaths in Canada in 2022
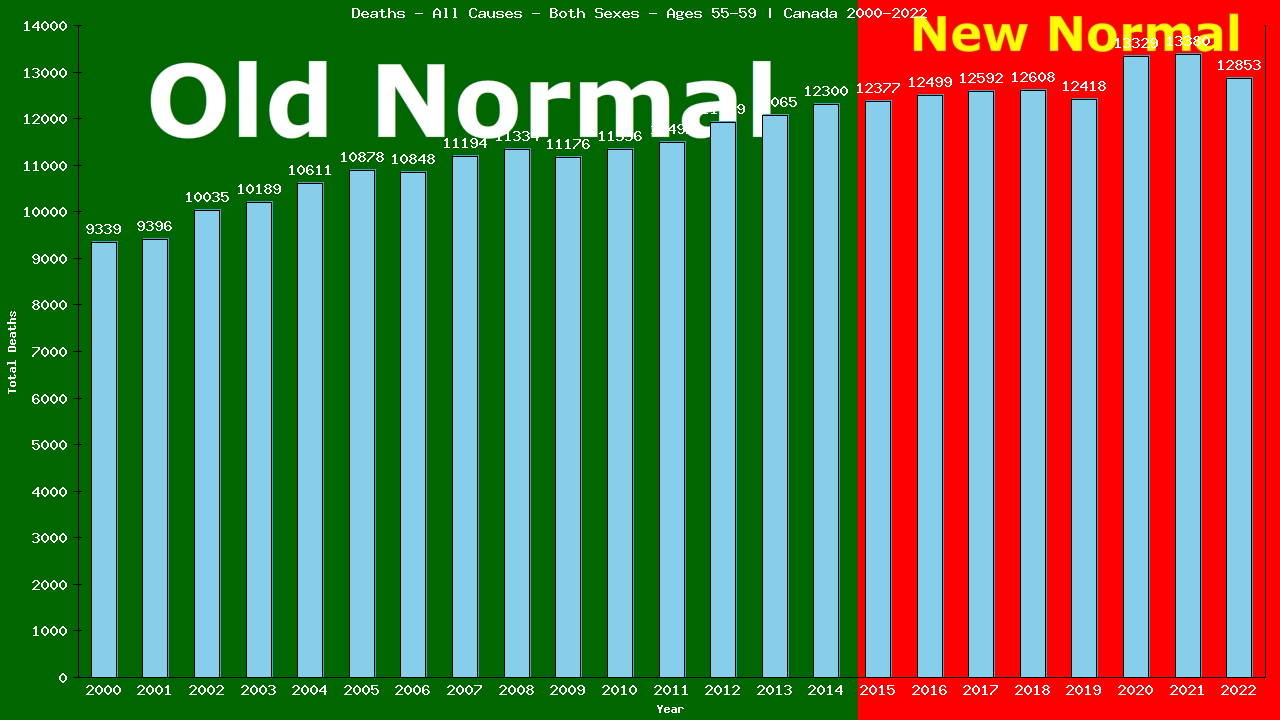
- 12,853 of all deaths were among those aged 55-59
12,853 deaths from All Causes were among people aged 55-59

2022 vs New Normal™ for people aged 55-59 in Canada
- 12,853 of 12,853 total deaths were from All Causes
- 100.00% of all deaths were from All Causes
- This is down 7% compared to Old Normal rates.
- 13,754 of 13,754 total deaths would have been expected under Old Normal conditions.
- 901 fewer than expected deaths from All Causes in 2022.
- 10,348 fewer than expected deaths from All Causes (2015-2022)
- To show this year’s deaths from All Causes are down 7% compared to Old Normal rates, we need to calculate the rates for both 2022 and for the Old Normal.
Remember, death rates are calculated to answer these questions:
- “How many people aged 55-59 were there?” and
- “How many of them died from All Causes?”
The following 2 charts provide this information:
Deaths – All Causes – Both Sexes – Aged 55-59 | Canada, Canada

Population – Both Sexes – Aged 55-59 – [2000-2022] | Canada, Canada
![Graph showing Population - Both Sexes - Aged 55-59 - [2000-2022] | Canada, Canada](/wp-content/plugins/dfuc-display/charts/canada/canada/2022/all/Both Sexes/55-59-pop.png)
From the charts, we can see that in 2022, 12,853 of 2,635,125 people aged 55-59 living in Canada died from All Causes.
12,853 ÷ 2,635,125 = 0.00488 (2022 CDR)
Deaths/100,000 Both Sexes 55-59 from All Causes

The table shows there were a total of 164,117 deaths from All Causes among 31,444,004 people aged 55-59 living in Canada in the 15 years immediately prior to the New Normal™.
164,117 ÷ 31,444,004 = 0.00522 (Old Normal CDR)
We can use the Old Normal rate to predict this year’s deaths:
2022 pop X Old Normal CDR = expected deaths
2,635,125 X 0.00522 = 13,754 expected deaths
The difference between actual and expected deaths shows lives saved or lost:
12,853 – 13,754 = -901
Dividing the actual deaths by the expected deaths gives us the comparative rates:
12,853 ÷ 13,754 = 0.9327
This reveals 901 lives saved and is 93.27% of what we expected (a decrease of 7%) in deaths from All Causes among people aged 55-59 living in Canada in 2022, as compared to the Old Normal.
This is the same method used by Public Health to calculate the 5-yr CDR (Cumulative Death Rate):
89,203 ÷ 18,900,875 = 0.00472 (5-yr CDR)
2,635,125(2022 pop) X 0.00472 = 12,437 expected deaths
The difference between actual and expected deaths:
12,853 – 12,437 = 416 or 416 lives lost
Divide actual deaths by expected deaths:
12,853 ÷ 12,437 = 1.0313 or an increase of 3%
for deaths from All Causes among people aged 55-59 living in Canada in 2022, as compared to the previous 5 years.
Compare our Old Normal to the 5yr CDR. Does it tell the same story your TV does?
Finally, the same method can also be used to compare our Old Normal rate to the New Normal™ rate:
New Normal™ population X Old Normal rate = expected deaths
21,536,000 X 0.00522 = 112,404 expected deaths
The difference between actual and expected deaths:
102056 – 112,404 = -10,348 or 10,348 lives saved
Dividing the actual deaths by the expected deaths:
102,056 ÷ 112,404 = 0.9062 or a decrease of 9%
in deaths from All Causes among people aged 55-59 living in Canada in the New Normal™, as compared to the Old Normal.
Ursula von der Leyen and her globalist buddies came up with UN “Sustainable” Development Goal SDG3 – “Ensure healthy lives and promote well-being for all at all ages” and began implementing it in 2015.
Browse through the tabs for all ages below to see the results of 8 years of their New Normal™
Is this health and well being?
Is this “sustainable”?
Can we allow this to continue?
The world has been led to believe that a deadly pandemic swept the globe beginning in 2020, causing an increase in death rates, especially among the elderly
The data show that death rates began to increase in 2015, immediately upon implementation of the UN’s 2030 Agenda for Sustainable Development, that young adults have experienced ever-increasing death rates since, and that death rates among the elderly have remained relatively stable.
Return to the top of the page to select another age category.


×