Excess Deaths

- Categories:
- Other ill-defined and unspecified causes of mortality (11)

- Unspecified fall (2)
- Exposure to unspecified factor (1)
- Other specified general symptoms and signs (0)
- Cachexia (0)
- Malaise and fatigue (0)
- Other and unspecified convulsions (0)
- Shock, unspecified (0)
- Unspecified event, undetermined intent (0)
- Bradycardia, unspecified (0)
- Pulseless electrical activity, not elsewhere classified (0)
- Syncope and collapse (0)
- Instantaneous death (0)
- Nausea and vomiting (0)
- Coma, unspecified (0)
- Chest pain, unspecified (0)
- Disorientation, unspecified (0)
- Fever, unspecified (0)
- Generalized oedema (0)
- Other chronic pain (0)
- Unspecified haematuria (0)
- Headache (0)
- Hyperglycaemia, unspecified (0)
- Other shock (0)
- Pain, unspecified (0)
- Sequelae of events of undetermined intent (0)
- Deaths: Government of Canada
- Population: Government of Canada
- 2000-2022 Unknown Causes deaths extrapolated from Canadian data
Quick Links
- There were a total of 6,144 deaths in Newfoundland in 2022
- 65 of all deaths were among those aged 40-44
- 383 of all deaths were from Unknown Causes
- 14 deaths from Unknown Causes were among those aged 40-44
14 deaths from Unknown Causes were among people aged 40-44

2022 vs New Normal™ for people aged 40-44 in Newfoundland
- 14 of 65 total deaths were from Unknown Causes
- 21.54% of all deaths were from Unknown Causes
- This is up 772% compared to Old Normal rates.
- 1 of 47 total deaths would have been expected under Old Normal conditions.
- 13 excess deaths from Unknown Causes in 2022.
- 18 excess All Cause deaths in 2022.
- 27 excess deaths from Unknown Causes (2015-2022)
- 49 excess All Cause deaths over the first 8 years of Newfoundland’s New Normal™.
- To show this year’s deaths from Unknown Causes are up 772% compared to Old Normal rates, we need to calculate the rates for both 2022 and for the Old Normal.
Remember, death rates are calculated to answer these questions:
- “How many people aged 40-44 were there?” and
- “How many of them died from Unknown Causes?”
The following 2 charts provide this information:
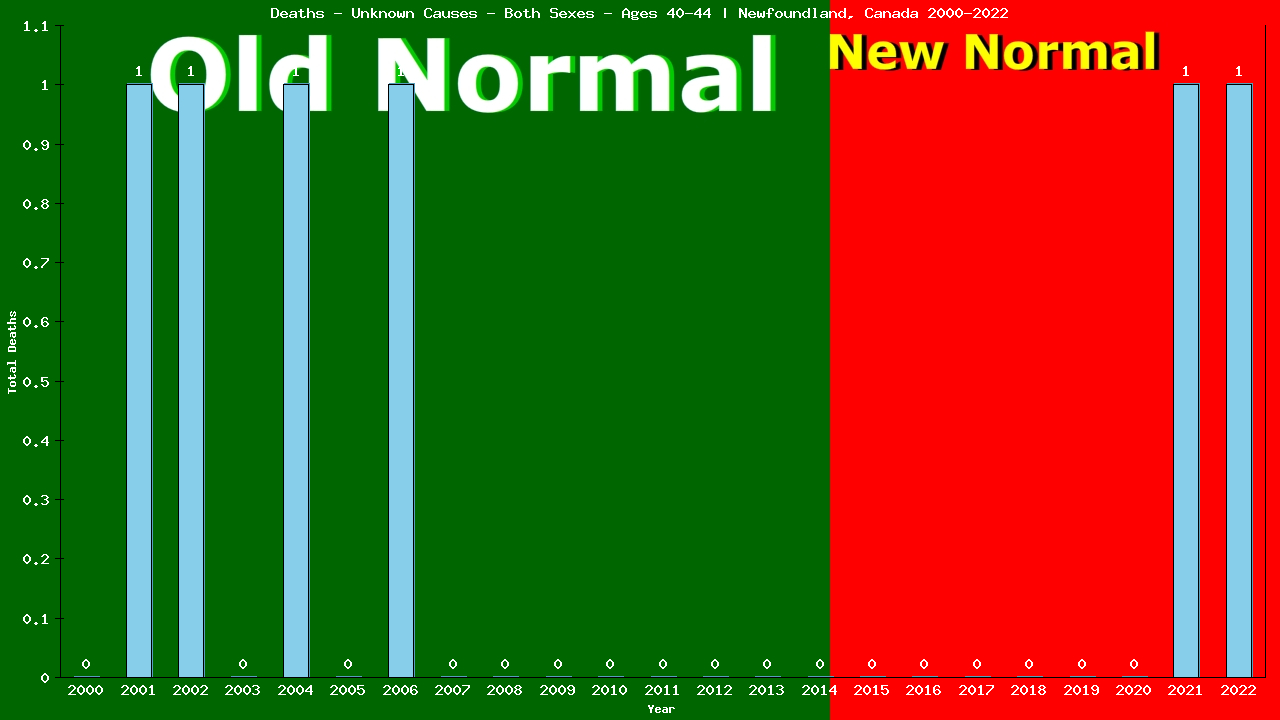
Deaths – Unknown Causes – Both Sexes – Aged 40-44 | Newfoundland, Canada
Population – Both Sexes – Aged 40-44 – [2000-2022] | Newfoundland, Canada
![Graph showing Population - Both Sexes - Aged 40-44 - [2000-2022] | Newfoundland, Canada](/wp-content/plugins/dfuc-display/charts/canada/newfoundland/2022/all/Both Sexes/40-44-pop.png)
From the charts, we can see that in 2022, 14 of 30,912 people aged 40-44 living in Newfoundland died from Unknown Causes.
14 ÷ 30,912 = 0.00045 (2022 CDR)
Deaths/100,000 Both Sexes 40-44 from Unknown Causes
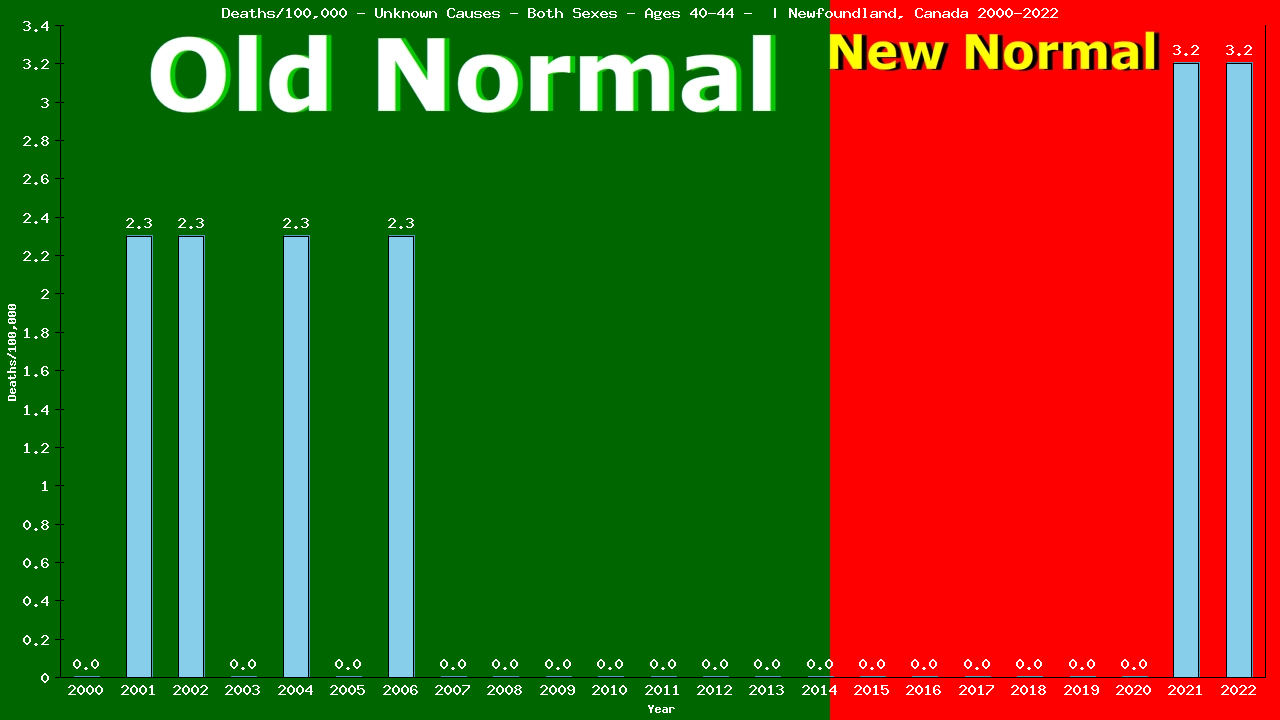
The table shows there were a total of 26 deaths from Unknown Causes among 619,642 people aged 40-44 living in Newfoundland in the 15 years immediately prior to the New Normal™.
26 ÷ 619,642 = 0.00004 (Old Normal CDR)
We can use the Old Normal rate to predict this year’s deaths:
2022 pop X Old Normal CDR = expected deaths
30,912 X 0.00004 = 1 expected deaths
The difference between actual and expected deaths shows lives saved or lost:
14 – 1 = 13
Dividing the actual deaths by the expected deaths gives us the comparative rates:
14 ÷ 1 = 8.7163
This reveals 13 lives lost and is 871.63% of what we expected (an increase of 772%) in deaths from Unknown Causes among people aged 40-44 living in Newfoundland in 2022, as compared to the Old Normal.
This is the same method used by Public Health to calculate the 5-yr CDR (Cumulative Death Rate):
24 ÷ 233,134 = 0.00010 (5-yr CDR)
30,912(2022 pop) X 0.00010 = 3 expected deaths
The difference between actual and expected deaths:
14 – 3 = 11 or 11 lives lost
Divide actual deaths by expected deaths:
14 ÷ 3 = 4.0099 or an increase of 301%
for deaths from Unknown Causes among people aged 40-44 living in Newfoundland in 2022, as compared to the previous 5 years.
Compare our Old Normal to the 5yr CDR. Does it tell the same story your TV does?
Finally, the same method can also be used to compare our Old Normal rate to the New Normal™ rate:
New Normal™ population X Old Normal rate = expected deaths
264,046 X 0.00004 = 11 expected deaths
The difference between actual and expected deaths:
38 – 11 = 27 or 27 lives lost
Dividing the actual deaths by the expected deaths:
38 ÷ 11 = 2.7697 or an increase of 177%
in deaths from Unknown Causes among people aged 40-44 living in Newfoundland in the New Normal™, as compared to the Old Normal.
The world has been led to believe that a deadly pandemic swept the globe beginning in 2020, causing an increase in death rates, especially among the elderly
The data show that death rates began to increase in 2015, immediately upon implementation of the UN’s 2030 Agenda for Sustainable Development, that young adults have experienced ever-increasing death rates since, and that death rates among the elderly have remained relatively stable.
Return to the top of the page to select another age category.


×