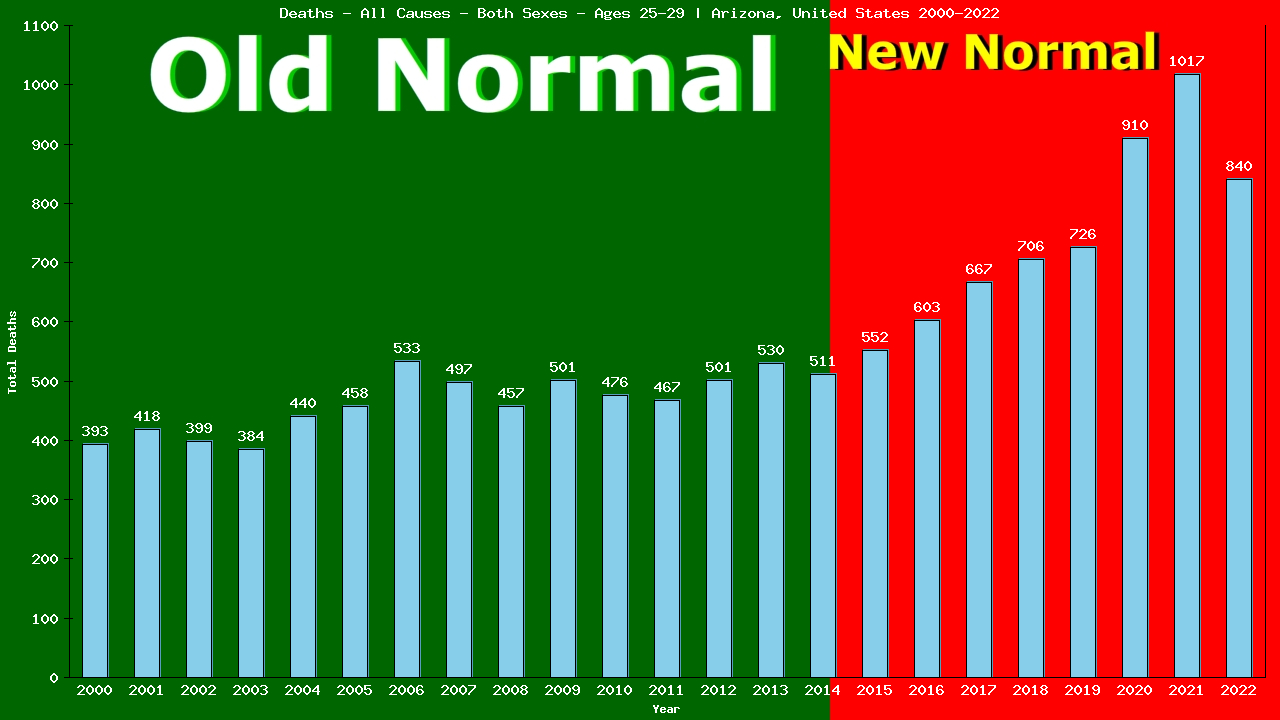
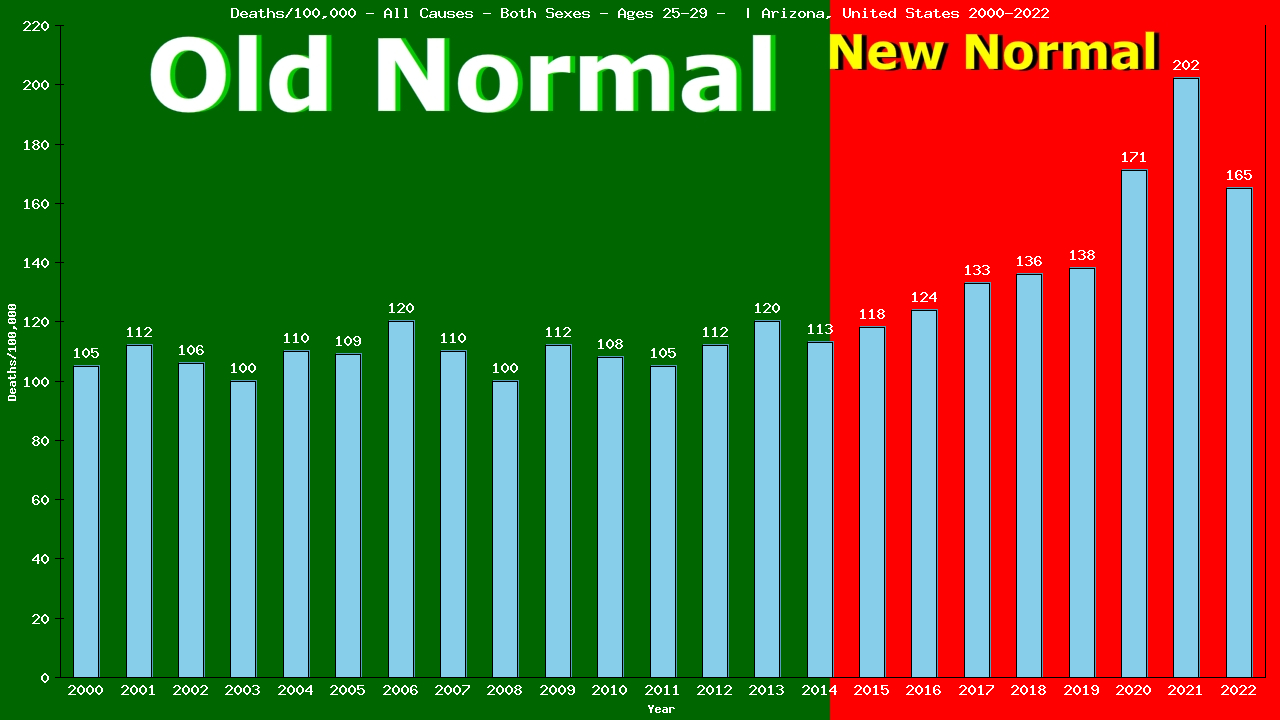
2022 vs New Normal™ for people aged 25-29 in Arizona
840 of 840 total deaths were from All Causes
100.00% of all deaths were from All Causes
This is up 49% compared to Old Normal rates.
558 of 558 total deaths would have been expected under Old Normal conditions.
282 more deaths from All Causes in 2022.
1,585 more deaths from All Causes (2015-2022)
To show this year’s deaths from All Causes are up 49% compared to Old Normal rates, we need to calculate the rates for both 2022 and for the Old Normal.
Remember, death rates are calculated to answer these questions:
“How many people aged 25-29 were there?” and
“How many of them died from All Causes?”
The following 2 charts provide this information:
Deaths – All Causes – Male – Aged 25-29 | Arizona, United-states
From the charts, we can see that in 2022, 840 of 507,896 people aged 25-29 living in Arizona died from All Causes.
840 ÷ 507,896 = 0.00165 (2022 CDR)
We’ll use the table below to calculate our Old Normal rate for deaths from All Causes
Old Normal (2001-2014) Arizona male aged 25-29 All Causes
Year
Pop
Died
From
|2000
374,106
393
393
|2001
371,096
418
418
|2002
376,202
399
399
|2003
383,859
384
384
|2004
398,820
440
440
|Year
Pop
Died
From
|2005
418,966
458
458
|2006
441,876
533
533
|2007
450,343
497
497
|2008
452,605
457
457
|2009
447,102
501
501
|Year
Pop
Died
From
|2010
439,998
476
476
|2011
443,697
467
467
|2012
443,898
501
501
|2013
441,348
530
530
|2014
452,152
511
511
Cumulative:
Population
Deaths
All Causes
Totals:
6,336,068
6,965
6,965
The table shows there were a total of 6,965 deaths from All Causes among 6,336,068 people aged 25-29 living in Arizona in the 15 years immediately prior to the New Normal™.
6,965 ÷ 6,336,068 = 0.00110 (Old Normal CDR)
We can use the Old Normal rate to predict this year’s deaths:
2022 pop X Old Normal CDR = expected deaths
507,896 X 0.00110 = 558 expected deaths
The difference between actual and expected deaths shows lives saved or lost:
840 – 558 = 282
Dividing the actual deaths by the expected deaths gives us the comparative rates:
840 ÷ 558 = 1.4910
This reveals 282 lives lost and is 149.10% of what we expected (an increase of 49%) in deaths from All Causes among people aged 25-29 living in Arizona in 2022, as compared to the Old Normal.
Compare our Old Normal to the 5yr CDR. Does it tell the same story your TV does?
5yr CDR (2017-2021)
Year
Pop
Died
From
|2017
499,932
667
667
|2018
517,980
706
706
|2019
525,879
726
726
|2020
529,789
910
910
|2021
502,670
1,017
1,017
Total:
3,527,182
5,181
5,181
This is the same method used by Public Health to calculate the 5-yr CDR (Cumulative Death Rate):
5,181 ÷ 3,527,182 = 0.00147 (5-yr CDR)
507,896(2022 pop) X 0.00147 = 746 expected deaths
The difference between actual and expected deaths:
840 – 746 = 94 or 94 lives lost
Divide actual deaths by expected deaths:
840 ÷ 746 = 1.1183 or an increase of 12%
for deaths from All Causes among people aged 25-29 living in Arizona in 2022, as compared to the previous 5 years.
Finally, the same method can also be used to compare our Old Normal rate to the New Normal™ rate:
New Normal™ population X Old Normal rate = expected deaths
4,035,078 X 0.00110 = 4,436 expected deaths
The difference between actual and expected deaths:
6021 – 4,436 = 1,585 or 1,585 lives lost
Dividing the actual deaths by the expected deaths:
6,021 ÷ 4,436 = 1.3452 or an increase of 35%
in deaths from All Causes among people aged 25-29 living in Arizona in the New Normal™, as compared to the Old Normal.
New Normal (2015-2022)
Year
Pop
Died
From
|2015
466,525
552
552
|2016
484,407
603
603
|2017
499,932
667
667
|2018
517,980
706
706
|2019
525,879
726
726
|2020
529,789
910
910
|2021
502,670
1,017
1,017
|2022
507,896
840
840
Total:
4,035,078
6,021
6,021
The world has been led to believe that a deadly pandemic swept the globe beginning in 2020, causing an increase in death rates, especially among the elderly
The data show that death rates began to increase in 2015, immediately upon implementation of the UN’s 2030 Agenda for Sustainable Development, that young adults have experienced ever-increasing death rates since, and that death rates among the elderly have remained relatively stable.
Browse through the age-categorized charts below to see the evidence of this. Click on any chart to see the full analysis for each age group.
74,079 of the 74,079 deaths among individuals of all ages living in Arizona in 2022 were from All Causes (100.00% of all deaths).
This is up 33% compared to Old Normal (2000-2014) rates which, when applied to the this year's both sexes population of 7,209,837 individuals would have predicted 55,610 deaths from All Causes.
This means there were 18,469 more deaths than expected from All Causes among individuals of all ages living in Arizona in 2022.
To date, 86,335 individual lives have been lost to All Causes over the first 8 years of Arizona's New Normal™.
Browse through the age categories below to learn how these deaths from All Causes in 2022 are distributed among each age group of individuals in Arizona.
Click the bar graph above to see how both the 2022 loss of 18,469 lives and the 8-year loss of 86,335 individual lives from All Causes is arrived at.
The first 486 of the 74,079 deaths from All Causes in 2022 were among babies in their first year of life, accounting for 100.00% of the 486 total deaths in this group.
This is down 6% compared to Old Normal rates which, when applied to this year's population of 78,579 babies in their first year of life, would have predicted 517 deaths from All Causes this year.
This means there were 31 fewer deaths than expected from All Causes among babies in their first year of life living in Arizona in 2022.
Overall, 3,594 deaths from All Causes represent 755 lives saved among babies in their first year of life over the first 8 years of Arizona's New Normal™.
Click the bar graph above to see how both the 2022 total of 31 fewer live lost than expected and the 8 year total of 3594 lives saved from All Causes among babies in their first year of life is arrived at.
Yearly All Causes Tally: 486 / 74,079
The next 105 of the 74,079 individual deaths from All Causes in 2022 were among pre-schoolers aged 1-4, accounting for 99.99% of the 105 total deaths in this group.
This is down 10% compared to Old Normal rates. Those rates, applied to this year's population of 316,427 pre-schoolers aged 1-4, would have predicted 113 deaths from All Causes this year.
This means there were 8 fewer deaths than expected from All Causes among pre-schoolers aged 1-4 living in Arizona in 2022.
Overall, 832 deaths from All Causes represent 143 lives saved among pre-schoolers aged 1-4 over the first 8 years of Arizona's New Normal™.
Click the bar graph above to see how the both the 2022 total of 8 fewer and the 8 year total of 832 fewer individual aged 1-4 deaths from All Causes is arrived at.
Yearly All Causes Tally: 591 / 74,079
The next 52 of the 74,079 individual deaths from All Causes in 2022 were among children aged 5-9, accounting for 99.98% of the 52 total deaths in this group.
This is down 25% compared to Old Normal rates. Those rates, applied to this year's population of 438,596 children aged 5-9, would have predicted 65 deaths from All Causes this year.
This means there were 13 fewer deaths than expected from All Causes among children aged 5-9 living in Arizona in 2022.
Overall, 408 deaths from All Causes represent 130 lives saved among children aged 5-9 over the first 8 years of Arizona's New Normal™.
Click the bar graph above to see how the both the 2022 total of 13 fewer and the 8 year total of 408 fewer individual aged 5-9 deaths from All Causes is arrived at.
Yearly All Causes Tally: 643 / 74,079
The next 74 of the 74,079 individual deaths from All Causes in 2022 were among children aged 10-14, accounting for 99.99% of the 74 total deaths in this group.
This is down 19% compared to Old Normal rates. Those rates, applied to this year's population of 462,912 children aged 10-14, would have predicted 87 deaths from All Causes this year.
This means there were 13 fewer deaths than expected from All Causes among children aged 10-14 living in Arizona in 2022.
Overall, 622 deaths from All Causes represent 84 lives saved among children aged 10-14 over the first 8 years of Arizona's New Normal™.
Click the bar graph above to see how the both the 2022 total of 13 fewer and the 8 year total of 622 fewer individual aged 10-14 deaths from All Causes is arrived at.
Yearly All Causes Tally: 717 / 74,079
The next 360 of the 74,079 individual deaths from All Causes in 2022 were among teens aged 15-19, accounting for 100.00% of the 360 total deaths in this group.
This is up 6% compared to Old Normal rates. Those rates, applied to this year's population of 486,307 teens aged 15-19, would have predicted 336 deaths from All Causes this year.
This means there were 24 more deaths than expected from All Causes among teens aged 15-19 living in Arizona in 2022.
Overall, 2,451 deaths from All Causes represent 171 lives saved among teens aged 15-19 over the first 8 years of Arizona's New Normal™.
Click the bar graph above to see how the both the 2022 total of 24 more and the 8 year total of 2,451 more individual aged 15-19 deaths from All Causes is arrived at.
Yearly All Causes Tally: 1,077 / 74,079
The next 603 of the 74,079 individual deaths from All Causes in 2022 were among people aged 20-24, accounting for 100.00% of the 603 total deaths in this group.
This is up 7% compared to Old Normal rates. Those rates, applied to this year's population of 525,749 people aged 20-24, would have predicted 557 deaths from All Causes this year.
This means there were 46 more deaths than expected from All Causes among people aged 20-24 living in Arizona in 2022.
Overall, 4,603 deaths from All Causes represent 398 lives lost among people aged 20-24 over the first 8 years of Arizona's New Normal™.
Click the bar graph above to see how the both the 2022 total of 46 more and the 8 year total of 4,603 more individual aged 20-24 deaths from All Causes is arrived at.
Yearly All Causes Tally: 1,680 / 74,079
The next 840 of the 74,079 individual deaths from All Causes in 2022 were among people aged 25-29, accounting for 100.00% of the 840 total deaths in this group.
This is up 49% compared to Old Normal rates. Those rates, applied to this year's population of 507,896 people aged 25-29, would have predicted 558 deaths from All Causes this year.
This means there were 282 more deaths than expected from All Causes among people aged 25-29 living in Arizona in 2022.
Overall, 6,021 deaths from All Causes represent 1,585 lives lost among people aged 25-29 over the first 8 years of Arizona's New Normal™.
Click the bar graph above to see how the both the 2022 total of 282 more and the 8 year total of 6,021 more individual aged 25-29 deaths from All Causes is arrived at.
Yearly All Causes Tally: 2,520 / 74,079
The next 1,180 of the 74,079 individual deaths from All Causes in 2022 were among people aged 30-34, accounting for 100.00% of the 1,180 total deaths in this group.
This is up 79% compared to Old Normal rates. Those rates, applied to this year's population of 510,436 people aged 30-34, would have predicted 655 deaths from All Causes this year.
This means there were 525 more deaths than expected from All Causes among people aged 30-34 living in Arizona in 2022.
Overall, 7,224 deaths from All Causes represent 2,336 lives lost among people aged 30-34 over the first 8 years of Arizona's New Normal™.
Click the bar graph above to see how the both the 2022 total of 525 more and the 8 year total of 7,224 more individual aged 30-34 deaths from All Causes is arrived at.
Yearly All Causes Tally: 3,700 / 74,079
The next 1,340 of the 74,079 individual deaths from All Causes in 2022 were among people aged 35-39, accounting for 100.00% of the 1,340 total deaths in this group.
This is up 69% compared to Old Normal rates. Those rates, applied to this year's population of 471,743 people aged 35-39, would have predicted 787 deaths from All Causes this year.
This means there were 553 more deaths than expected from All Causes among people aged 35-39 living in Arizona in 2022.
Overall, 8,152 deaths from All Causes represent 2,080 lives lost among people aged 35-39 over the first 8 years of Arizona's New Normal™.
Click the bar graph above to see how the both the 2022 total of 553 more and the 8 year total of 8,152 more individual aged 35-39 deaths from All Causes is arrived at.
Yearly All Causes Tally: 5,040 / 74,079
The next 1,491 of the 74,079 individual deaths from All Causes in 2022 were among people aged 40-44, accounting for 100.00% of the 1,491 total deaths in this group.
This is up 37% compared to Old Normal rates. Those rates, applied to this year's population of 454,313 people aged 40-44, would have predicted 1,086 deaths from All Causes this year.
This means there were 405 more deaths than expected from All Causes among people aged 40-44 living in Arizona in 2022.
Overall, 9,198 deaths from All Causes represent 986 lives lost among people aged 40-44 over the first 8 years of Arizona's New Normal™.
Click the bar graph above to see how the both the 2022 total of 405 more and the 8 year total of 9,198 more individual aged 40-44 deaths from All Causes is arrived at.
Yearly All Causes Tally: 6,531 / 74,079
The next 1,747 of the 74,079 individual deaths from All Causes in 2022 were among people aged 45-49, accounting for 100.00% of the 1,747 total deaths in this group.
This is up 17% compared to Old Normal rates. Those rates, applied to this year's population of 418,746 people aged 45-49, would have predicted 1,491 deaths from All Causes this year.
This means there were 256 more deaths than expected from All Causes among people aged 45-49 living in Arizona in 2022.
Overall, 12,738 deaths from All Causes represent 637 lives lost among people aged 45-49 over the first 8 years of Arizona's New Normal™.
Click the bar graph above to see how the both the 2022 total of 256 more and the 8 year total of 12,738 more individual aged 45-49 deaths from All Causes is arrived at.
Yearly All Causes Tally: 8,278 / 74,079
The next 2,461 of the 74,079 individual deaths from All Causes in 2022 were among people aged 50-54, accounting for 100.00% of the 2,461 total deaths in this group.
This is up 12% compared to Old Normal rates. Those rates, applied to this year's population of 433,144 people aged 50-54, would have predicted 2,201 deaths from All Causes this year.
This means there were 260 more deaths than expected from All Causes among people aged 50-54 living in Arizona in 2022.
Overall, 18,537 deaths from All Causes represent 1,246 lives lost among people aged 50-54 over the first 8 years of Arizona's New Normal™.
Click the bar graph above to see how the both the 2022 total of 260 more and the 8 year total of 18,537 more individual aged 50-54 deaths from All Causes is arrived at.
Yearly All Causes Tally: 10,739 / 74,079
The next 3,659 of the 74,079 individual deaths from All Causes in 2022 were among people aged 55-59, accounting for 100.00% of the 3,659 total deaths in this group.
This is up 20% compared to Old Normal rates. Those rates, applied to this year's population of 427,682 people aged 55-59, would have predicted 3,048 deaths from All Causes this year.
This means there were 611 more deaths than expected from All Causes among people aged 55-59 living in Arizona in 2022.
Overall, 27,971 deaths from All Causes represent 3,073 lives lost among people aged 55-59 over the first 8 years of Arizona's New Normal™.
Click the bar graph above to see how the both the 2022 total of 611 more and the 8 year total of 27,971 more individual aged 55-59 deaths from All Causes is arrived at.
Yearly All Causes Tally: 14,398 / 74,079
The next 5,288 of the 74,079 individual deaths from All Causes in 2022 were among people aged 60-64, accounting for 100.00% of the 5,288 total deaths in this group.
This is up 19% compared to Old Normal rates. Those rates, applied to this year's population of 444,281 people aged 60-64, would have predicted 4,447 deaths from All Causes this year.
This means there were 841 more deaths than expected from All Causes among people aged 60-64 living in Arizona in 2022.
Overall, 37,923 deaths from All Causes represent 3,981 lives lost among people aged 60-64 over the first 8 years of Arizona's New Normal™.
Click the bar graph above to see how the both the 2022 total of 841 more and the 8 year total of 37,923 more individual aged 60-64 deaths from All Causes is arrived at.
Yearly All Causes Tally: 19,686 / 74,079
The next 6,652 of the 74,079 individual deaths from All Causes in 2022 were among elderly men and women aged 65-69, accounting for 100.00% of the 6,652 total deaths in this group.
This is up 13% compared to Old Normal rates. Those rates, applied to this year's population of 414,980 elderly men and women aged 65-69, would have predicted 5,905 deaths from All Causes this year.
This means there were 747 more deaths than expected from All Causes among elderly men and women aged 65-69 living in Arizona in 2022.
Overall, 47,059 deaths from All Causes represent 2,042 lives lost among elderly men and women aged 65-69 over the first 8 years of Arizona's New Normal™.
Click the bar graph above to see how the both the 2022 total of 747 more and the 8 year total of 47,059 more individual aged 65-69 deaths from All Causes is arrived at.
Yearly All Causes Tally: 26,338 / 74,079
The next 8,549 of the 74,079 individual deaths from All Causes in 2022 were among elderly men and women aged 70-74, accounting for 100.00% of the 8,549 total deaths in this group.
This is up 8% compared to Old Normal rates. Those rates, applied to this year's population of 365,727 elderly men and women aged 70-74, would have predicted 7,945 deaths from All Causes this year.
This means there were 604 more deaths than expected from All Causes among elderly men and women aged 70-74 living in Arizona in 2022.
Overall, 57,580 deaths from All Causes represent 1,121 lives saved among elderly men and women aged 70-74 over the first 8 years of Arizona's New Normal™.
Click the bar graph above to see how the both the 2022 total of 604 more and the 8 year total of 57,580 more individual aged 70-74 deaths from All Causes is arrived at.
Yearly All Causes Tally: 34,887 / 74,079
The next 9,782 of the 74,079 individual deaths from All Causes in 2022 were among elderly men and women aged 75-79, accounting for 100.00% of the 9,782 total deaths in this group.
This is down 0% compared to Old Normal rates. Those rates, applied to this year's population of 280,982 elderly men and women aged 75-79, would have predicted 9,817 deaths from All Causes this year.
This means there were 35 fewer deaths than expected from All Causes among elderly men and women aged 75-79 living in Arizona in 2022.
Overall, 64,028 deaths from All Causes represent 3,431 lives saved among elderly men and women aged 75-79 over the first 8 years of Arizona's New Normal™.
Click the bar graph above to see how the both the 2022 total of 35 fewer and the 8 year total of 64,028 fewer individual aged 75-79 deaths from All Causes is arrived at.
Yearly All Causes Tally: 44,669 / 74,079
The next 9,899 of the 74,079 individual deaths from All Causes in 2022 were among elderly men and women aged 80-84, accounting for 100.00% of the 9,899 total deaths in this group.
This is down 2% compared to Old Normal rates. Those rates, applied to this year's population of 171,337 elderly men and women aged 80-84, would have predicted 10,081 deaths from All Causes this year.
This means there were 182 fewer deaths than expected from All Causes among elderly men and women aged 80-84 living in Arizona in 2022.
Overall, 67,023 deaths from All Causes represent 5,058 lives saved among elderly men and women aged 80-84 over the first 8 years of Arizona's New Normal™.
Click the bar graph above to see how the both the 2022 total of 182 fewer and the 8 year total of 67,023 fewer individual aged 80-84 deaths from All Causes is arrived at.
Yearly All Causes Tally: 54,568 / 74,079
The next 29,410 of the 74,079 deaths from All Causes in 2022 were among elderly men and women aged 80+, accounting for 100.00% of the 29,410 total deaths in this group.
This is up 1% compared to Old Normal rates which, when applied to this year's population of 171,337 would have predicted 29,029 deaths from All Causes this year.
This means there were 381 more deaths than expected from All Causes among elderly men and women aged 80+ living in Arizona in 2022.
Overall, 210,521 deaths from All Causes represent 2,967 lives lost among elderly men and women aged 80+ over the first 8 years of Arizona's New Normal™.
Click the bar graph above to see how the 8 year total of 210,521 excess individual deaths from All Causes is arrived at.
Yearly All Causes Tally: 83,978 / 74,079*
* Arizona does not report the deaths of 9,899 babies in it's death totals