
Excess Deaths

- Categories:
- Total (792)

- References
- Deaths: Data Notes
- Population: Centers for Disease Control and Prevention, National Center for Health Statistics
Quick Links
- There were a total of 57,049 deaths in Kentucky in 2022
- 29,606 of all deaths were among men
- 1,285 of all deaths were among those aged 40-44
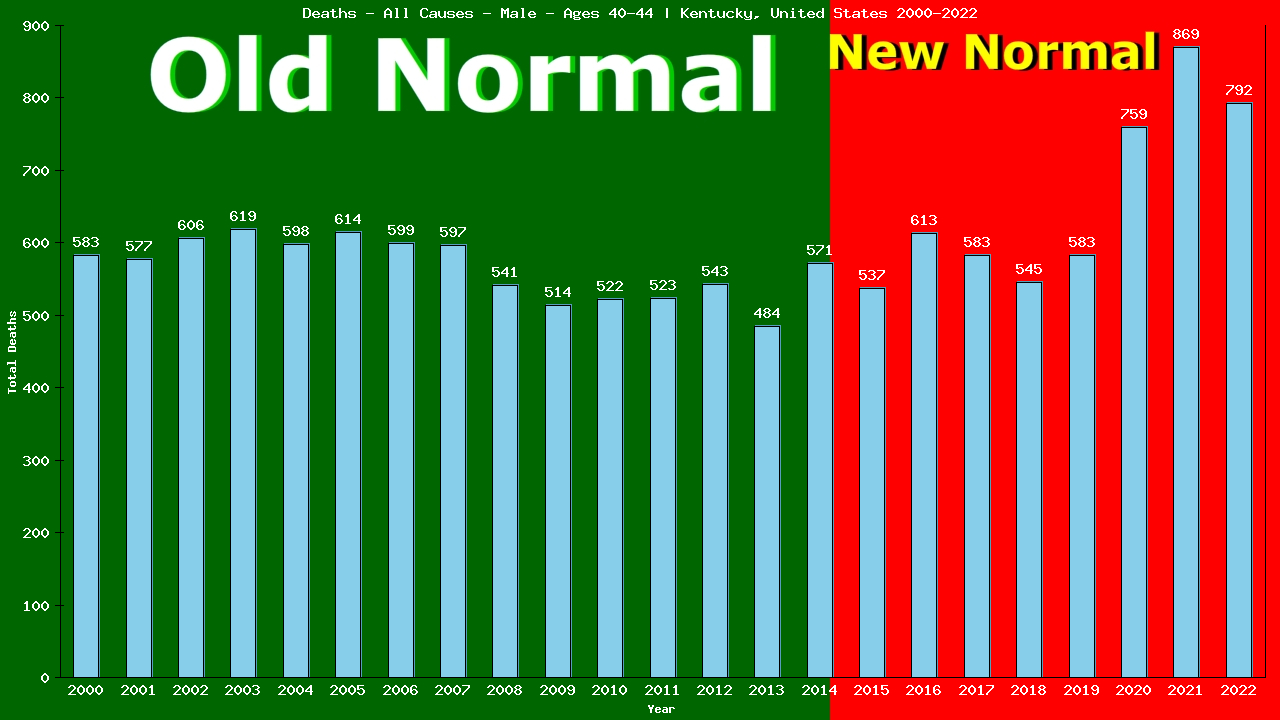
- 792 of all deaths were among men aged 40-44
792 deaths from All Causes were among men aged 40-44

2022 vs New Normal™ for men aged 40-44 in Kentucky
- 792 of 792 total deaths were from All Causes
- 100.00% of all deaths were from All Causes
- This is up 49% compared to Old Normal rates.
- 532 of 532 total deaths would have been expected under Old Normal conditions.
- 260 excess deaths from All Causes in 2022.
- 1,198 excess deaths from All Causes (2015-2022)
- To show this year’s deaths from All Causes are up 49% compared to Old Normal rates, we need to calculate the rates for both 2022 and for the Old Normal.
Remember, death rates are calculated to answer these questions:
- “How many men aged 40-44 were there?” and
- “How many of them died from All Causes?”
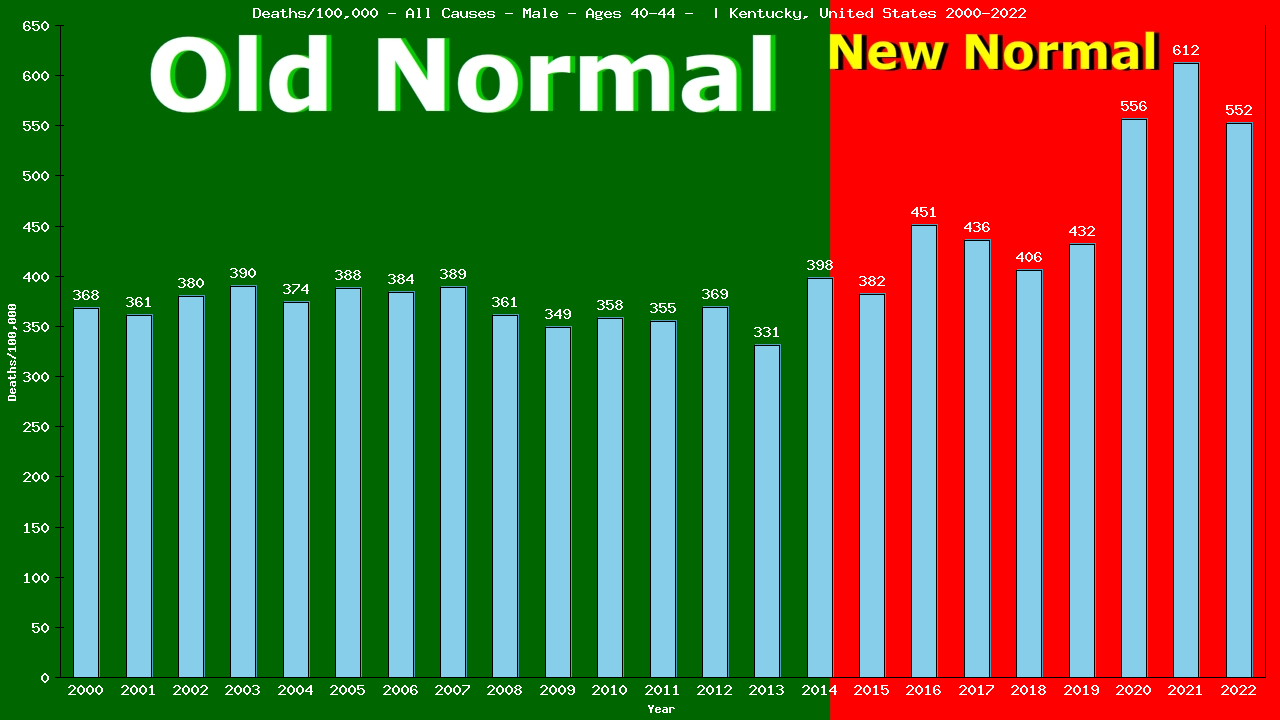
The following 2 charts provide this information:
Deaths – All Causes – Male – Aged 40-44 | Kentucky, United-states
Population – Male – Aged 40-44 – [2000-2022] | Kentucky, United-states
![Graph showing Population - Male - Aged 40-44 - [2000-2022] | Kentucky, United-states](/wp-content/plugins/dfuc-display/charts/united-states/kentucky/2022/all/Male/40-44-pop.png)
From the charts, we can see that in 2022, 792 of 143,303 men aged 40-44 living in Kentucky died from All Causes.
792 ÷ 143,303 = 0.00553 (2022 CDR)
The table shows there were a total of 8,491 deaths from All Causes among 2,288,478 men aged 40-44 living in Kentucky in the 15 years immediately prior to the New Normal™.
8,491 ÷ 2,288,478 = 0.00371 (Old Normal CDR)
We can use the Old Normal rate to predict this year’s deaths:
2022 pop X Old Normal CDR = expected deaths
143,303 X 0.00371 = 532 expected deaths
The difference between actual and expected deaths shows lives saved or lost:
792 – 532 = 260
Dividing the actual deaths by the expected deaths gives us the comparative rates:
792 ÷ 532 = 1.4856
This reveals 260 lives lost and is 148.56% of what we expected (an increase of 49%) in deaths from All Causes among men aged 40-44 living in Kentucky in 2022, as compared to the Old Normal.
This is the same method used by Public Health to calculate the 5-yr CDR (Cumulative Death Rate):
4,489 ÷ 957,197 = 0.00469 (5-yr CDR)
143,303(2022 pop) X 0.00469 = 672 expected deaths
The difference between actual and expected deaths:
792 – 672 = 120 or 120 lives lost
Divide actual deaths by expected deaths:
792 ÷ 672 = 1.1760 or an increase of 18%
for deaths from All Causes among men aged 40-44 living in Kentucky in 2022, as compared to the previous 5 years.
Compare our Old Normal to the 5yr CDR. Does it tell the same story your TV does?
Finally, the same method can also be used to compare our Old Normal rate to the New Normal™ rate:
New Normal™ population X Old Normal rate = expected deaths
1,100,500 X 0.00371 = 4,083 expected deaths
The difference between actual and expected deaths:
5281 – 4,083 = 1,198 or 1,198 lives lost
Dividing the actual deaths by the expected deaths:
5,281 ÷ 4,083 = 1.2899 or an increase of 29%
in deaths from All Causes among men aged 40-44 living in Kentucky in the New Normal™, as compared to the Old Normal.
The world has been led to believe that a deadly pandemic swept the globe beginning in 2020, causing an increase in death rates, especially among the elderly
The data show that death rates began to increase in 2015, immediately upon implementation of the UN’s 2030 Agenda for Sustainable Development, that young adults have experienced ever-increasing death rates since, and that death rates among the elderly have remained relatively stable.
Return to the top of the page to select another age category.
Deaths/100,000 male 40-44 from All Causes









×