2022 vs New Normal™ for elderly men and women aged 80+ in Maryland
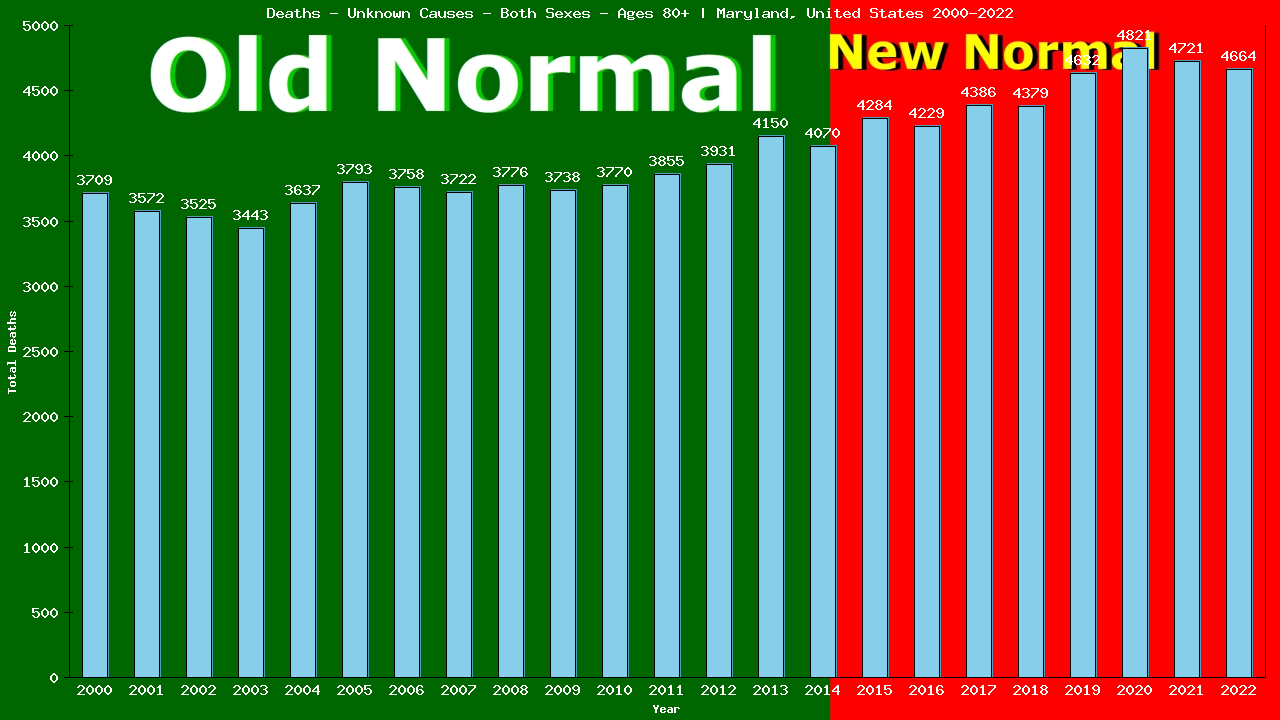
4,664 of 23,172 total deaths were from Unknown Causes
20.13% of all deaths were from Unknown Causes
This is down 1% compared to Old Normal rates.
4,732 of 23,466 total deaths would have been expected under Old Normal conditions.
68 fewer deaths from Unknown Causes in 2022.
294 fewer All Cause deaths in 2022.
2,334 more deaths from Unknown Causes (2015-2022)
9,077 more All Cause deaths over the first 8 years of Maryland’s New Normal™.
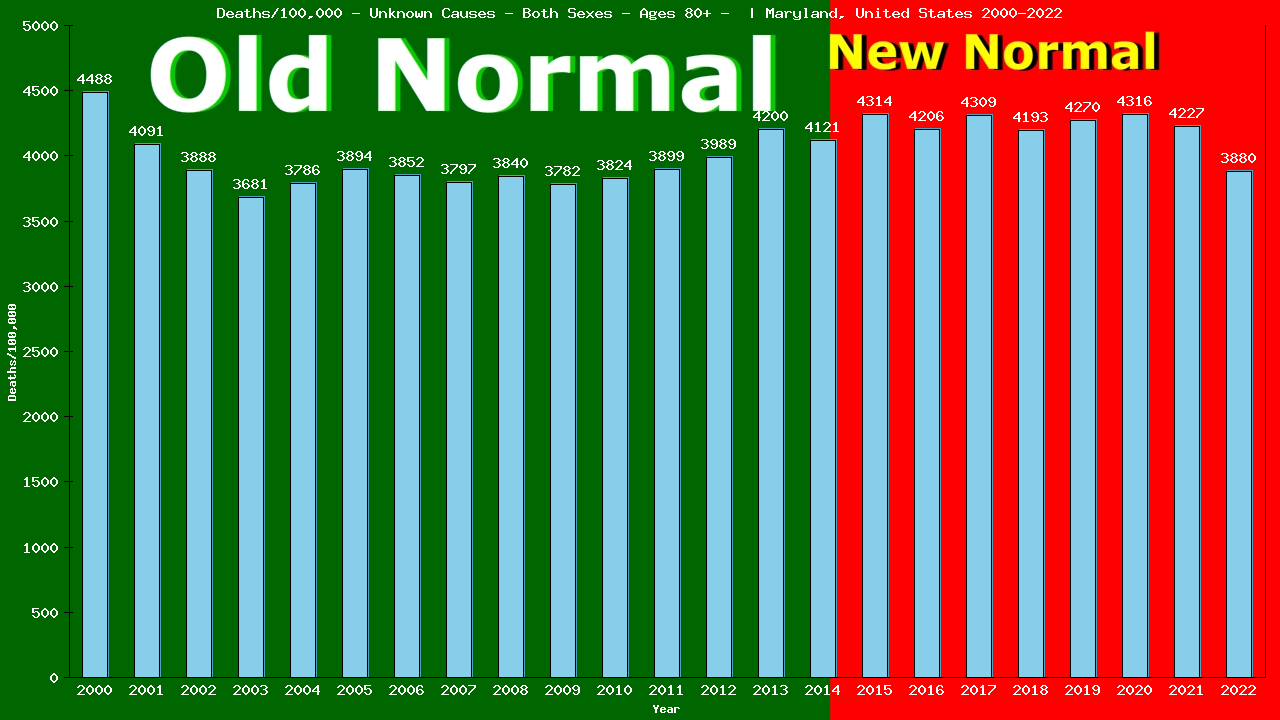
To show this year’s deaths from Unknown Causes are down 1% compared to Old Normal rates, we need to calculate the rates for both 2022 and for the Old Normal.
Remember, death rates are calculated to answer these questions:
“How many elderly men and women aged 80+ were there?” and
“How many of them died from Unknown Causes?”
The following 2 charts provide this information:
Deaths – Unknown Causes – Elderly Men And Women – Aged 80+ | Maryland, United-states
Population – Elderly Men And Women – Aged 80+ – [2000-2022] | Maryland, United-states
From the charts, we can see that in 2022, 4,664 of 120,179 elderly men and women aged 80+ living in Maryland died from Unknown Causes.
4,664 ÷ 120,179 = 0.03881 (2022 CDR)
We’ll use the table below to calculate our Old Normal rate for deaths from Unknown Causes
Old Normal (2001-2014) Maryland elderly men and women aged 80+ Unknown Causes
Year
Pop
Died
From
|2000
82,629
17,072
3,709
|2001
87,303
17,223
3,572
|2002
90,647
17,613
3,525
|2003
93,515
17,982
3,443
|2004
96,057
17,754
3,637
|Year
Pop
Died
From
|2005
97,405
18,398
3,793
|2006
97,538
18,309
3,758
|2007
98,011
18,696
3,722
|2008
98,326
18,990
3,776
|2009
98,827
19,085
3,738
|Year
Pop
Died
From
|2010
98,580
19,069
3,770
|2011
98,863
19,520
3,855
|2012
98,543
19,950
3,931
|2013
98,788
20,349
4,150
|2014
98,754
19,950
4,070
Cumulative:
Population
Deaths
Unknown Causes
Totals:
1,433,786
279,960
56,449
The table shows there were a total of 56,449 deaths from Unknown Causes among 1,433,786 elderly men and women aged 80+ living in Maryland in the 15 years immediately prior to the New Normal™.
56,449 ÷ 1,433,786 = 0.03937 (Old Normal CDR)
We can use the Old Normal rate to predict this year’s deaths:
2022 pop X Old Normal CDR = expected deaths
120,179 X 0.03937 = 4,732 expected deaths
The difference between actual and expected deaths shows lives saved or lost:
4,664 – 4,732 = -68
Dividing the actual deaths by the expected deaths gives us the comparative rates:
4,664 ÷ 4,732 = 0.9855
This reveals 68 lives saved and is 98.55% of what we expected (a decrease of 1%) in deaths from Unknown Causes among elderly men and women aged 80+ living in Maryland in 2022, as compared to the Old Normal.
5yr CDR (2017-2021)
Year
Pop
Died
From
|2017
101,780
21,133
4,386
|2018
104,431
21,572
4,379
|2019
108,469
21,260
4,632
|2020
111,683
25,035
4,821
|2021
111,676
23,067
4,721
Total:
737,862
153,445
31,452
This is the same method used by Public Health to calculate the 5-yr CDR (Cumulative Death Rate):
31,452 ÷ 737,862 = 0.04263 (5-yr CDR)
120,179(2022 pop) X 0.04263 = 5,123 expected deaths
The difference between actual and expected deaths:
4,664 – 5,123 = -459 or 459 lives saved
Divide actual deaths by expected deaths:
4,664 ÷ 5,123 = 0.9102 or a decrease of 9%
for deaths from Unknown Causes among elderly men and women aged 80+ living in Maryland in 2022, as compared to the previous 5 years.
Compare our Old Normal to the 5yr CDR. Does it tell the same story your TV does?
Finally, the same method can also be used to compare our Old Normal rate to the New Normal™ rate:
New Normal™ population X Old Normal rate = expected deaths
858,041 X 0.03937 = 33,782 expected deaths
The difference between actual and expected deaths:
36116 – 33,782 = 2,334 or 2,334 lives lost
Dividing the actual deaths by the expected deaths:
36,116 ÷ 33,782 = 1.0688 or an increase of 7%
in deaths from Unknown Causes among elderly men and women aged 80+ living in Maryland in the New Normal™, as compared to the Old Normal.
New Normal (2015-2022)
Year
Pop
Died
From
|2015
99,291
20,786
4,284
|2016
100,532
20,592
4,229
|2017
101,780
21,133
4,386
|2018
104,431
21,572
4,379
|2019
108,469
21,260
4,632
|2020
111,683
25,035
4,821
|2021
111,676
23,067
4,721
|2022
120,179
23,172
4,664
Total:
858,041
176,617
36,116
The world has been led to believe that a deadly pandemic swept the globe beginning in 2020, causing an increase in death rates, especially among the elderly
The data show that death rates began to increase in 2015, immediately upon implementation of the UN’s 2030 Agenda for Sustainable Development, that young adults have experienced ever-increasing death rates since, and that death rates among the elderly have remained relatively stable.
Browse through the age-categorized charts below to see the evidence of this. Click on any chart to see the full analysis for each age group.
Deaths/100,000 elderly men and women 80+ from Unknown Causes
16,008 of the 56,456 deaths among individuals of all ages living in Maryland in 2022 were from Unknown Causes (28.35% of all deaths).
This is up 9% compared to Old Normal (2000-2014) rates which, when applied to the this year's both sexes population of 6,044,429 individuals would have predicted 14,676 deaths from Unknown Causes.
This means there were 1,332 more deaths than expected from Unknown Causes among individuals of all ages living in Maryland in 2022.
To date, 5,970 individual lives have been lost to Unknown Causes over the first 8 years of Maryland's New Normal™.
Browse through the age categories below to learn how these deaths from Unknown Causes in 2022 are distributed among each age group of individuals in Maryland.
Click the bar graph above to see how both the 2022 loss of 1,332 lives and the 8-year loss of 5,970 individual lives from Unknown Causes is arrived at.
The first 353 of the 16,008 deaths from Unknown Causes in 2022 were among babies in their first year of life, accounting for 83.65% of the 422 total deaths in this group.
This is up 0% compared to Old Normal rates which, when applied to this year's population of 69,158 babies in their first year of life, would have predicted 351 deaths from Unknown Causes this year.
This means there were 2 more deaths than expected from Unknown Causes among babies in their first year of life living in Maryland in 2022.
Overall, 2,656 deaths from Unknown Causes represent 203 lives saved among babies in their first year of life over the first 8 years of Maryland's New Normal™.
Click the bar graph above to see how both the 2022 total of 2 more live lost than expected and the 8 year total of 2656 lives saved from Unknown Causes among babies in their first year of life is arrived at.
Yearly Unknown Causes Tally: 353 / 16,008
The next 64 of the 16,008 individual deaths from Unknown Causes in 2022 were among pre-schoolers aged 1-4, accounting for 99.98% of the 64 total deaths in this group.
This is down 19% compared to Old Normal rates. Those rates, applied to this year's population of 280,686 pre-schoolers aged 1-4, would have predicted 76 deaths from Unknown Causes this year.
This means there were 12 fewer deaths than expected from Unknown Causes among pre-schoolers aged 1-4 living in Maryland in 2022.
Overall, 543 deaths from Unknown Causes represent 90 lives saved among pre-schoolers aged 1-4 over the first 8 years of Maryland's New Normal™.
Click the bar graph above to see how the both the 2022 total of 12 fewer and the 8 year total of 543 fewer individual aged 1-4 deaths from Unknown Causes is arrived at.
Yearly Unknown Causes Tally: 417 / 16,008
The next 43 of the 16,008 individual deaths from Unknown Causes in 2022 were among children aged 5-9, accounting for 99.98% of the 43 total deaths in this group.
This is down 17% compared to Old Normal rates. Those rates, applied to this year's population of 371,417 children aged 5-9, would have predicted 48 deaths from Unknown Causes this year.
This means there were 5 fewer deaths than expected from Unknown Causes among children aged 5-9 living in Maryland in 2022.
Overall, 315 deaths from Unknown Causes represent 71 lives saved among children aged 5-9 over the first 8 years of Maryland's New Normal™.
Click the bar graph above to see how the both the 2022 total of 5 fewer and the 8 year total of 315 fewer individual aged 5-9 deaths from Unknown Causes is arrived at.
Yearly Unknown Causes Tally: 460 / 16,008
The next 65 of the 16,008 individual deaths from Unknown Causes in 2022 were among children aged 10-14, accounting for 99.98% of the 65 total deaths in this group.
This is up 1% compared to Old Normal rates. Those rates, applied to this year's population of 387,223 children aged 10-14, would have predicted 62 deaths from Unknown Causes this year.
This means there were 3 more deaths than expected from Unknown Causes among children aged 10-14 living in Maryland in 2022.
Overall, 409 deaths from Unknown Causes represent 74 lives saved among children aged 10-14 over the first 8 years of Maryland's New Normal™.
Click the bar graph above to see how the both the 2022 total of 3 more and the 8 year total of 409 more individual aged 10-14 deaths from Unknown Causes is arrived at.
Yearly Unknown Causes Tally: 525 / 16,008
The next 165 of the 16,008 individual deaths from Unknown Causes in 2022 were among teens aged 15-19, accounting for 71.12% of the 232 total deaths in this group.
This is down 4% compared to Old Normal rates. Those rates, applied to this year's population of 388,243 teens aged 15-19, would have predicted 169 deaths from Unknown Causes this year.
This means there were 4 fewer deaths than expected from Unknown Causes among teens aged 15-19 living in Maryland in 2022.
Overall, 1,137 deaths from Unknown Causes represent 199 lives saved among teens aged 15-19 over the first 8 years of Maryland's New Normal™.
Click the bar graph above to see how the both the 2022 total of 4 fewer and the 8 year total of 1,137 fewer individual aged 15-19 deaths from Unknown Causes is arrived at.
Yearly Unknown Causes Tally: 690 / 16,008
The next 244 of the 16,008 individual deaths from Unknown Causes in 2022 were among people aged 20-24, accounting for 57.14% of the 427 total deaths in this group.
This is up 1% compared to Old Normal rates. Those rates, applied to this year's population of 384,265 people aged 20-24, would have predicted 243 deaths from Unknown Causes this year.
This means there were 1 more deaths than expected from Unknown Causes among people aged 20-24 living in Maryland in 2022.
Overall, 1,762 deaths from Unknown Causes represent 167 lives saved among people aged 20-24 over the first 8 years of Maryland's New Normal™.
Click the bar graph above to see how the both the 2022 total of 1 more and the 8 year total of 1,762 more individual aged 20-24 deaths from Unknown Causes is arrived at.
Yearly Unknown Causes Tally: 934 / 16,008
The next 286 of the 16,008 individual deaths from Unknown Causes in 2022 were among people aged 25-29, accounting for 46.50% of the 615 total deaths in this group.
This is up 3% compared to Old Normal rates. Those rates, applied to this year's population of 385,067 people aged 25-29, would have predicted 273 deaths from Unknown Causes this year.
This means there were 13 more deaths than expected from Unknown Causes among people aged 25-29 living in Maryland in 2022.
Overall, 2,174 deaths from Unknown Causes represent 149 lives saved among people aged 25-29 over the first 8 years of Maryland's New Normal™.
Click the bar graph above to see how the both the 2022 total of 13 more and the 8 year total of 2,174 more individual aged 25-29 deaths from Unknown Causes is arrived at.
Yearly Unknown Causes Tally: 1,220 / 16,008
The next 383 of the 16,008 individual deaths from Unknown Causes in 2022 were among people aged 30-34, accounting for 48.05% of the 797 total deaths in this group.
This is up 0% compared to Old Normal rates. Those rates, applied to this year's population of 424,098 people aged 30-34, would have predicted 377 deaths from Unknown Causes this year.
This means there were 6 more deaths than expected from Unknown Causes among people aged 30-34 living in Maryland in 2022.
Overall, 2,780 deaths from Unknown Causes represent 201 lives saved among people aged 30-34 over the first 8 years of Maryland's New Normal™.
Click the bar graph above to see how the both the 2022 total of 6 more and the 8 year total of 2,780 more individual aged 30-34 deaths from Unknown Causes is arrived at.
Yearly Unknown Causes Tally: 1,603 / 16,008
The next 467 of the 16,008 individual deaths from Unknown Causes in 2022 were among people aged 35-39, accounting for 50.49% of the 925 total deaths in this group.
This is down 8% compared to Old Normal rates. Those rates, applied to this year's population of 425,644 people aged 35-39, would have predicted 506 deaths from Unknown Causes this year.
This means there were 39 fewer deaths than expected from Unknown Causes among people aged 35-39 living in Maryland in 2022.
Overall, 3,427 deaths from Unknown Causes represent 449 lives saved among people aged 35-39 over the first 8 years of Maryland's New Normal™.
Click the bar graph above to see how the both the 2022 total of 39 fewer and the 8 year total of 3,427 fewer individual aged 35-39 deaths from Unknown Causes is arrived at.
Yearly Unknown Causes Tally: 2,070 / 16,008
The next 606 of the 16,008 individual deaths from Unknown Causes in 2022 were among people aged 40-44, accounting for 56.69% of the 1,069 total deaths in this group.
This is down 3% compared to Old Normal rates. Those rates, applied to this year's population of 408,010 people aged 40-44, would have predicted 618 deaths from Unknown Causes this year.
This means there were 12 fewer deaths than expected from Unknown Causes among people aged 40-44 living in Maryland in 2022.
Overall, 4,475 deaths from Unknown Causes represent 141 lives saved among people aged 40-44 over the first 8 years of Maryland's New Normal™.
Click the bar graph above to see how the both the 2022 total of 12 fewer and the 8 year total of 4,475 fewer individual aged 40-44 deaths from Unknown Causes is arrived at.
Yearly Unknown Causes Tally: 2,676 / 16,008
The next 741 of the 16,008 individual deaths from Unknown Causes in 2022 were among people aged 45-49, accounting for 60.29% of the 1,229 total deaths in this group.
This is up 6% compared to Old Normal rates. Those rates, applied to this year's population of 367,177 people aged 45-49, would have predicted 698 deaths from Unknown Causes this year.
This means there were 43 more deaths than expected from Unknown Causes among people aged 45-49 living in Maryland in 2022.
Overall, 5,728 deaths from Unknown Causes represent 229 lives saved among people aged 45-49 over the first 8 years of Maryland's New Normal™.
Click the bar graph above to see how the both the 2022 total of 43 more and the 8 year total of 5,728 more individual aged 45-49 deaths from Unknown Causes is arrived at.
Yearly Unknown Causes Tally: 3,417 / 16,008
The next 888 of the 16,008 individual deaths from Unknown Causes in 2022 were among people aged 50-54, accounting for 46.32% of the 1,917 total deaths in this group.
This is down 5% compared to Old Normal rates. Those rates, applied to this year's population of 404,531 people aged 50-54, would have predicted 930 deaths from Unknown Causes this year.
This means there were 42 fewer deaths than expected from Unknown Causes among people aged 50-54 living in Maryland in 2022.
Overall, 7,499 deaths from Unknown Causes represent 267 lives saved among people aged 50-54 over the first 8 years of Maryland's New Normal™.
Click the bar graph above to see how the both the 2022 total of 42 fewer and the 8 year total of 7,499 fewer individual aged 50-54 deaths from Unknown Causes is arrived at.
Yearly Unknown Causes Tally: 4,305 / 16,008
The next 1,165 of the 16,008 individual deaths from Unknown Causes in 2022 were among people aged 55-59, accounting for 39.12% of the 2,978 total deaths in this group.
This is down 1% compared to Old Normal rates. Those rates, applied to this year's population of 420,229 people aged 55-59, would have predicted 1,176 deaths from Unknown Causes this year.
This means there were 11 fewer deaths than expected from Unknown Causes among people aged 55-59 living in Maryland in 2022.
Overall, 9,385 deaths from Unknown Causes represent 224 lives saved among people aged 55-59 over the first 8 years of Maryland's New Normal™.
Click the bar graph above to see how the both the 2022 total of 11 fewer and the 8 year total of 9,385 fewer individual aged 55-59 deaths from Unknown Causes is arrived at.
Yearly Unknown Causes Tally: 5,470 / 16,008
The next 1,415 of the 16,008 individual deaths from Unknown Causes in 2022 were among people aged 60-64, accounting for 32.68% of the 4,330 total deaths in this group.
This is down 4% compared to Old Normal rates. Those rates, applied to this year's population of 404,703 people aged 60-64, would have predicted 1,463 deaths from Unknown Causes this year.
This means there were 48 fewer deaths than expected from Unknown Causes among people aged 60-64 living in Maryland in 2022.
Overall, 10,565 deaths from Unknown Causes represent 509 lives saved among people aged 60-64 over the first 8 years of Maryland's New Normal™.
Click the bar graph above to see how the both the 2022 total of 48 fewer and the 8 year total of 10,565 fewer individual aged 60-64 deaths from Unknown Causes is arrived at.
Yearly Unknown Causes Tally: 6,885 / 16,008
The next 1,484 of the 16,008 individual deaths from Unknown Causes in 2022 were among elderly men and women aged 65-69, accounting for 27.93% of the 5,314 total deaths in this group.
This is down 12% compared to Old Normal rates. Those rates, applied to this year's population of 337,771 elderly men and women aged 65-69, would have predicted 1,680 deaths from Unknown Causes this year.
This means there were 196 fewer deaths than expected from Unknown Causes among elderly men and women aged 65-69 living in Maryland in 2022.
Overall, 10,890 deaths from Unknown Causes represent 1,602 lives saved among elderly men and women aged 65-69 over the first 8 years of Maryland's New Normal™.
Click the bar graph above to see how the both the 2022 total of 196 fewer and the 8 year total of 10,890 fewer individual aged 65-69 deaths from Unknown Causes is arrived at.
Yearly Unknown Causes Tally: 8,369 / 16,008
The next 1,472 of the 16,008 individual deaths from Unknown Causes in 2022 were among elderly men and women aged 70-74, accounting for 24.46% of the 6,019 total deaths in this group.
This is down 19% compared to Old Normal rates. Those rates, applied to this year's population of 270,510 elderly men and women aged 70-74, would have predicted 1,809 deaths from Unknown Causes this year.
This means there were 337 fewer deaths than expected from Unknown Causes among elderly men and women aged 70-74 living in Maryland in 2022.
Overall, 10,994 deaths from Unknown Causes represent 1,938 lives saved among elderly men and women aged 70-74 over the first 8 years of Maryland's New Normal™.
Click the bar graph above to see how the both the 2022 total of 337 fewer and the 8 year total of 10,994 fewer individual aged 70-74 deaths from Unknown Causes is arrived at.
Yearly Unknown Causes Tally: 9,841 / 16,008
The next 1,503 of the 16,008 individual deaths from Unknown Causes in 2022 were among elderly men and women aged 75-79, accounting for 21.98% of the 6,838 total deaths in this group.
This is down 14% compared to Old Normal rates. Those rates, applied to this year's population of 195,518 elderly men and women aged 75-79, would have predicted 1,752 deaths from Unknown Causes this year.
This means there were 249 fewer deaths than expected from Unknown Causes among elderly men and women aged 75-79 living in Maryland in 2022.
Overall, 10,726 deaths from Unknown Causes represent 1,094 lives saved among elderly men and women aged 75-79 over the first 8 years of Maryland's New Normal™.
Click the bar graph above to see how the both the 2022 total of 249 fewer and the 8 year total of 10,726 fewer individual aged 75-79 deaths from Unknown Causes is arrived at.
Yearly Unknown Causes Tally: 11,344 / 16,008
The next 1,404 of the 16,008 individual deaths from Unknown Causes in 2022 were among elderly men and women aged 80-84, accounting for 20.22% of the 6,945 total deaths in this group.
This is down 6% compared to Old Normal rates. Those rates, applied to this year's population of 120,179 elderly men and women aged 80-84, would have predicted 1,489 deaths from Unknown Causes this year.
This means there were 85 fewer deaths than expected from Unknown Causes among elderly men and women aged 80-84 living in Maryland in 2022.
Overall, 10,406 deaths from Unknown Causes represent 222 lives saved among elderly men and women aged 80-84 over the first 8 years of Maryland's New Normal™.
Click the bar graph above to see how the both the 2022 total of 85 fewer and the 8 year total of 10,406 fewer individual aged 80-84 deaths from Unknown Causes is arrived at.
Yearly Unknown Causes Tally: 12,748 / 16,008
The next 4,664 of the 16,008 deaths from Unknown Causes in 2022 were among elderly men and women aged 80+, accounting for 20.13% of the 23,172 total deaths in this group.
This is down 1% compared to Old Normal rates which, when applied to this year's population of 120,179 would have predicted 4,732 deaths from Unknown Causes this year.
This means there were 68 fewer deaths than expected from Unknown Causes among elderly men and women aged 80+ living in Maryland in 2022.
Overall, 36,116 deaths from Unknown Causes represent 2,334 lives lost among elderly men and women aged 80+ over the first 8 years of Maryland's New Normal™.
Click the bar graph above to see how the 8 year total of 36,116 excess individual deaths from Unknown Causes is arrived at.
Yearly Unknown Causes Tally: 17,412 / 16,008*
* Maryland does not report the deaths of 1,404 babies in it's death totals