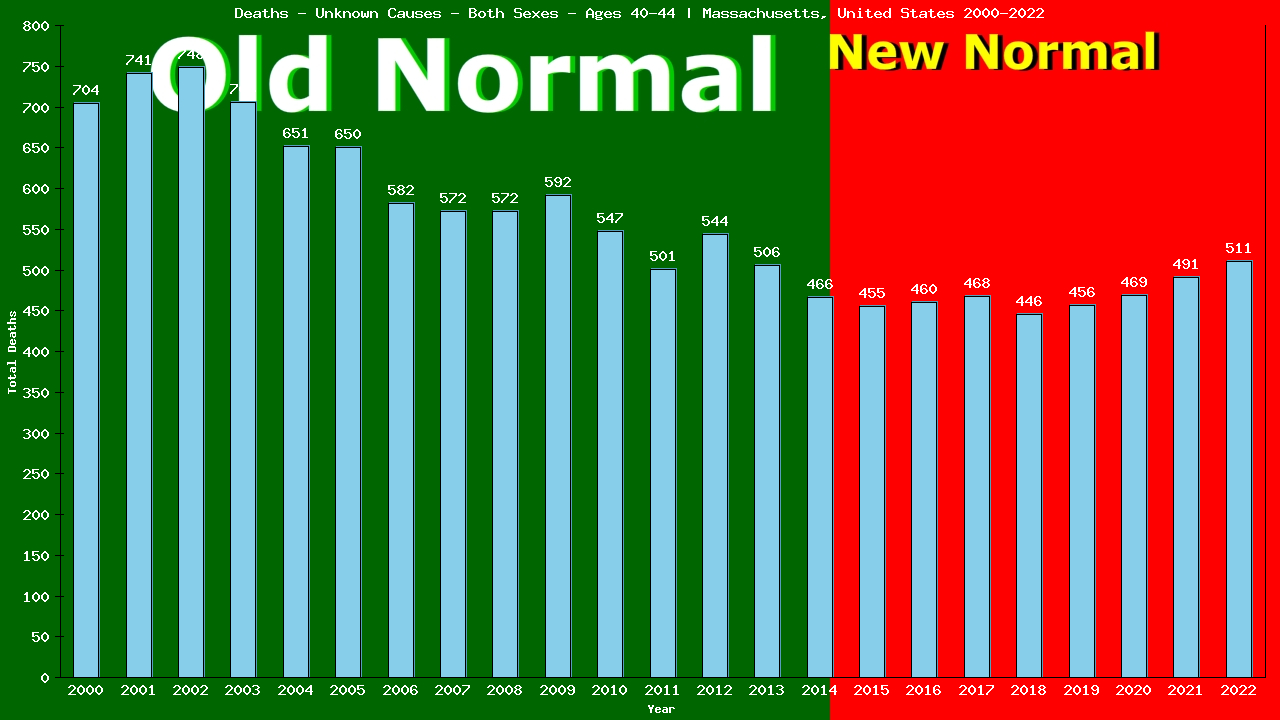
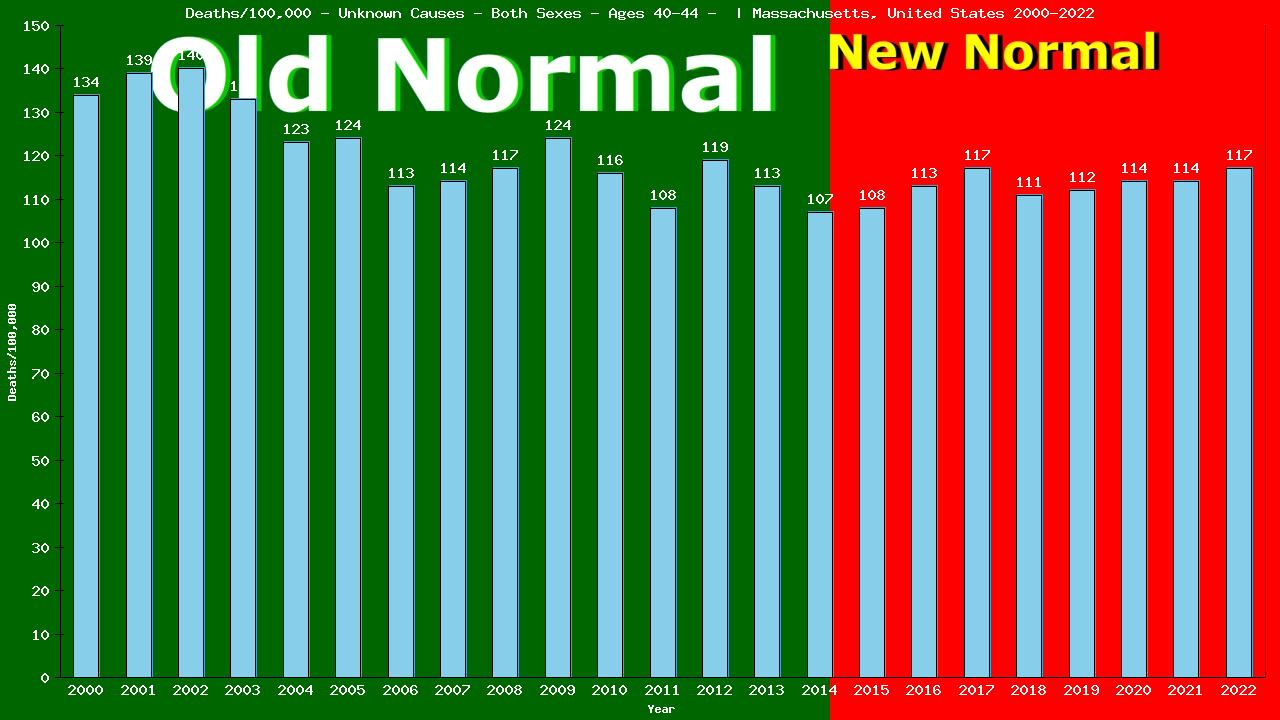
2022 vs New Normal™ for people aged 40-44 in Massachusetts
511 of 973 total deaths were from Unknown Causes
52.52% of all deaths were from Unknown Causes
This is down 5% compared to Old Normal rates.
532 of 785 total deaths would have been expected under Old Normal conditions.
21 fewer deaths from Unknown Causes in 2022.
188 more All Cause deaths in 2022.
292 fewer deaths from Unknown Causes (2015-2022)
719 more All Cause deaths over the first 8 years of Massachusetts’s New Normal™.
To show this year’s deaths from Unknown Causes are down 5% compared to Old Normal rates, we need to calculate the rates for both 2022 and for the Old Normal.
Remember, death rates are calculated to answer these questions:
Population – Male – Aged 40-44 – [2000-2022] | Massachusetts, United-states
From the charts, we can see that in 2022, 511 of 433,914 people aged 40-44 living in Massachusetts died from Unknown Causes.
511 ÷ 433,914 = 0.00118 (2022 CDR)
We’ll use the table below to calculate our Old Normal rate for deaths from Unknown Causes
Old Normal (2001-2014) Massachusetts male aged 40-44 Unknown Causes
Year
Pop
Died
From
|2000
522,402
1,028
704
|2001
530,248
1,102
741
|2002
531,345
1,110
748
|2003
529,760
1,078
706
|2004
527,700
992
651
|Year
Pop
Died
From
|2005
521,079
991
650
|2006
511,005
881
582
|2007
499,666
857
572
|2008
488,473
807
572
|2009
474,958
839
592
|Year
Pop
Died
From
|2010
468,954
768
547
|2011
463,591
750
501
|2012
456,641
735
544
|2013
444,477
749
506
|2014
432,783
713
466
Cumulative:
Population
Deaths
Unknown Causes
Totals:
7,403,082
13,400
9,082
The table shows there were a total of 9,082 deaths from Unknown Causes among 7,403,082 people aged 40-44 living in Massachusetts in the 15 years immediately prior to the New Normal™.
9,082 ÷ 7,403,082 = 0.00123 (Old Normal CDR)
We can use the Old Normal rate to predict this year’s deaths:
2022 pop X Old Normal CDR = expected deaths
433,914 X 0.00123 = 532 expected deaths
The difference between actual and expected deaths shows lives saved or lost:
511 – 532 = -21
Dividing the actual deaths by the expected deaths gives us the comparative rates:
511 ÷ 532 = 0.9522
This reveals 21 lives saved and is 95.22% of what we expected (a decrease of 5%) in deaths from Unknown Causes among people aged 40-44 living in Massachusetts in 2022, as compared to the Old Normal.
5yr CDR (2017-2021)
Year
Pop
Died
From
|2017
399,866
754
468
|2018
400,571
769
446
|2019
403,572
790
456
|2020
408,671
918
469
|2021
427,937
984
491
Total:
2,866,061
5,719
3,245
This is the same method used by Public Health to calculate the 5-yr CDR (Cumulative Death Rate):
3,245 ÷ 2,866,061 = 0.00113 (5-yr CDR)
433,914(2022 pop) X 0.00113 = 491 expected deaths
The difference between actual and expected deaths:
511 – 491 = 20 or 20 lives lost
Divide actual deaths by expected deaths:
511 ÷ 491 = 1.0310 or an increase of 3%
for deaths from Unknown Causes among people aged 40-44 living in Massachusetts in 2022, as compared to the previous 5 years.
Compare our Old Normal to the 5yr CDR. Does it tell the same story your TV does?
Finally, the same method can also be used to compare our Old Normal rate to the New Normal™ rate:
New Normal™ population X Old Normal rate = expected deaths
3,299,975 X 0.00123 = 4,048 expected deaths
The difference between actual and expected deaths:
3756 – 4,048 = -292 or 292 lives saved
Dividing the actual deaths by the expected deaths:
3,756 ÷ 4,048 = 0.9203 or a decrease of 8%
in deaths from Unknown Causes among people aged 40-44 living in Massachusetts in the New Normal™, as compared to the Old Normal.
New Normal (2015-2022)
Year
Pop
Died
From
|2015
420,820
716
455
|2016
404,624
788
460
|2017
399,866
754
468
|2018
400,571
769
446
|2019
403,572
790
456
|2020
408,671
918
469
|2021
427,937
984
491
|2022
433,914
973
511
Total:
3,299,975
6,692
3,756
The world has been led to believe that a deadly pandemic swept the globe beginning in 2020, causing an increase in death rates, especially among the elderly
The data show that death rates began to increase in 2015, immediately upon implementation of the UN’s 2030 Agenda for Sustainable Development, that young adults have experienced ever-increasing death rates since, and that death rates among the elderly have remained relatively stable.
Browse through the age-categorized charts below to see the evidence of this. Click on any chart to see the full analysis for each age group.
Deaths/100,000 male 40-44 from Unknown Causes
16,394 of the 63,366 deaths among individuals of all ages living in Massachusetts in 2022 were from Unknown Causes (25.87% of all deaths).
This is up 7% compared to Old Normal (2000-2014) rates which, when applied to the this year's both sexes population of 6,831,080 individuals would have predicted 15,232 deaths from Unknown Causes.
This means there were 1,162 more deaths than expected from Unknown Causes among individuals of all ages living in Massachusetts in 2022.
To date, 7,853 individual lives have been lost to Unknown Causes over the first 8 years of Massachusetts's New Normal™.
Browse through the age categories below to learn how these deaths from Unknown Causes in 2022 are distributed among each age group of individuals in Massachusetts.
Click the bar graph above to see how both the 2022 loss of 1,162 lives and the 8-year loss of 7,853 individual lives from Unknown Causes is arrived at.
The first 208 of the 16,394 deaths from Unknown Causes in 2022 were among babies in their first year of life, accounting for 91.63% of the 227 total deaths in this group.
This is down 20% compared to Old Normal rates which, when applied to this year's population of 70,623 babies in their first year of life, would have predicted 258 deaths from Unknown Causes this year.
This means there were 50 fewer deaths than expected from Unknown Causes among babies in their first year of life living in Massachusetts in 2022.
Overall, 1,782 deaths from Unknown Causes represent 279 lives saved among babies in their first year of life over the first 8 years of Massachusetts's New Normal™.
Click the bar graph above to see how both the 2022 total of 50 fewer live lost than expected and the 8 year total of 1782 lives saved from Unknown Causes among babies in their first year of life is arrived at.
Yearly Unknown Causes Tally: 208 / 16,394
The next 41 of the 16,394 individual deaths from Unknown Causes in 2022 were among pre-schoolers aged 1-4, accounting for 99.98% of the 41 total deaths in this group.
This is down 16% compared to Old Normal rates. Those rates, applied to this year's population of 272,973 pre-schoolers aged 1-4, would have predicted 46 deaths from Unknown Causes this year.
This means there were 5 fewer deaths than expected from Unknown Causes among pre-schoolers aged 1-4 living in Massachusetts in 2022.
Overall, 324 deaths from Unknown Causes represent 63 lives saved among pre-schoolers aged 1-4 over the first 8 years of Massachusetts's New Normal™.
Click the bar graph above to see how the both the 2022 total of 5 fewer and the 8 year total of 324 fewer individual aged 1-4 deaths from Unknown Causes is arrived at.
Yearly Unknown Causes Tally: 249 / 16,394
The next 36 of the 16,394 individual deaths from Unknown Causes in 2022 were among children aged 5-9, accounting for 99.97% of the 36 total deaths in this group.
This is up 1% compared to Old Normal rates. Those rates, applied to this year's population of 362,938 children aged 5-9, would have predicted 33 deaths from Unknown Causes this year.
This means there were 3 more deaths than expected from Unknown Causes among children aged 5-9 living in Massachusetts in 2022.
Overall, 241 deaths from Unknown Causes represent 10 lives saved among children aged 5-9 over the first 8 years of Massachusetts's New Normal™.
Click the bar graph above to see how the both the 2022 total of 3 more and the 8 year total of 241 more individual aged 5-9 deaths from Unknown Causes is arrived at.
Yearly Unknown Causes Tally: 285 / 16,394
The next 36 of the 16,394 individual deaths from Unknown Causes in 2022 were among children aged 10-14, accounting for 99.97% of the 36 total deaths in this group.
This is down 21% compared to Old Normal rates. Those rates, applied to this year's population of 384,262 children aged 10-14, would have predicted 42 deaths from Unknown Causes this year.
This means there were 6 fewer deaths than expected from Unknown Causes among children aged 10-14 living in Massachusetts in 2022.
Overall, 291 deaths from Unknown Causes represent 47 lives saved among children aged 10-14 over the first 8 years of Massachusetts's New Normal™.
Click the bar graph above to see how the both the 2022 total of 6 fewer and the 8 year total of 291 fewer individual aged 10-14 deaths from Unknown Causes is arrived at.
Yearly Unknown Causes Tally: 321 / 16,394
The next 110 of the 16,394 individual deaths from Unknown Causes in 2022 were among teens aged 15-19, accounting for 74.32% of the 148 total deaths in this group.
This is down 7% compared to Old Normal rates. Those rates, applied to this year's population of 449,051 teens aged 15-19, would have predicted 114 deaths from Unknown Causes this year.
This means there were 4 fewer deaths than expected from Unknown Causes among teens aged 15-19 living in Massachusetts in 2022.
Overall, 864 deaths from Unknown Causes represent 60 lives saved among teens aged 15-19 over the first 8 years of Massachusetts's New Normal™.
Click the bar graph above to see how the both the 2022 total of 4 fewer and the 8 year total of 864 fewer individual aged 15-19 deaths from Unknown Causes is arrived at.
Yearly Unknown Causes Tally: 431 / 16,394
The next 150 of the 16,394 individual deaths from Unknown Causes in 2022 were among people aged 20-24, accounting for 53.38% of the 281 total deaths in this group.
This is down 28% compared to Old Normal rates. Those rates, applied to this year's population of 494,871 people aged 20-24, would have predicted 205 deaths from Unknown Causes this year.
This means there were 55 fewer deaths than expected from Unknown Causes among people aged 20-24 living in Massachusetts in 2022.
Overall, 1,221 deaths from Unknown Causes represent 400 lives saved among people aged 20-24 over the first 8 years of Massachusetts's New Normal™.
Click the bar graph above to see how the both the 2022 total of 55 fewer and the 8 year total of 1,221 fewer individual aged 20-24 deaths from Unknown Causes is arrived at.
Yearly Unknown Causes Tally: 581 / 16,394
The next 202 of the 16,394 individual deaths from Unknown Causes in 2022 were among people aged 25-29, accounting for 46.76% of the 432 total deaths in this group.
This is down 12% compared to Old Normal rates. Those rates, applied to this year's population of 480,930 people aged 25-29, would have predicted 225 deaths from Unknown Causes this year.
This means there were 23 fewer deaths than expected from Unknown Causes among people aged 25-29 living in Massachusetts in 2022.
Overall, 1,786 deaths from Unknown Causes represent 65 lives saved among people aged 25-29 over the first 8 years of Massachusetts's New Normal™.
Click the bar graph above to see how the both the 2022 total of 23 fewer and the 8 year total of 1,786 fewer individual aged 25-29 deaths from Unknown Causes is arrived at.
Yearly Unknown Causes Tally: 783 / 16,394
The next 323 of the 16,394 individual deaths from Unknown Causes in 2022 were among people aged 30-34, accounting for 48.64% of the 664 total deaths in this group.
This is up 4% compared to Old Normal rates. Those rates, applied to this year's population of 492,707 people aged 30-34, would have predicted 307 deaths from Unknown Causes this year.
This means there were 16 more deaths than expected from Unknown Causes among people aged 30-34 living in Massachusetts in 2022.
Overall, 2,508 deaths from Unknown Causes represent 107 lives lost among people aged 30-34 over the first 8 years of Massachusetts's New Normal™.
Click the bar graph above to see how the both the 2022 total of 16 more and the 8 year total of 2,508 more individual aged 30-34 deaths from Unknown Causes is arrived at.
Yearly Unknown Causes Tally: 1,106 / 16,394
The next 422 of the 16,394 individual deaths from Unknown Causes in 2022 were among people aged 35-39, accounting for 47.58% of the 887 total deaths in this group.
This is down 2% compared to Old Normal rates. Those rates, applied to this year's population of 471,810 people aged 35-39, would have predicted 427 deaths from Unknown Causes this year.
This means there were 5 fewer deaths than expected from Unknown Causes among people aged 35-39 living in Massachusetts in 2022.
Overall, 3,037 deaths from Unknown Causes represent 169 lives saved among people aged 35-39 over the first 8 years of Massachusetts's New Normal™.
Click the bar graph above to see how the both the 2022 total of 5 fewer and the 8 year total of 3,037 fewer individual aged 35-39 deaths from Unknown Causes is arrived at.
Yearly Unknown Causes Tally: 1,528 / 16,394
The next 511 of the 16,394 individual deaths from Unknown Causes in 2022 were among people aged 40-44, accounting for 52.52% of the 973 total deaths in this group.
This is down 5% compared to Old Normal rates. Those rates, applied to this year's population of 433,914 people aged 40-44, would have predicted 532 deaths from Unknown Causes this year.
This means there were 21 fewer deaths than expected from Unknown Causes among people aged 40-44 living in Massachusetts in 2022.
Overall, 3,756 deaths from Unknown Causes represent 292 lives saved among people aged 40-44 over the first 8 years of Massachusetts's New Normal™.
Click the bar graph above to see how the both the 2022 total of 21 fewer and the 8 year total of 3,756 fewer individual aged 40-44 deaths from Unknown Causes is arrived at.
Yearly Unknown Causes Tally: 2,039 / 16,394
The next 576 of the 16,394 individual deaths from Unknown Causes in 2022 were among people aged 45-49, accounting for 53.48% of the 1,077 total deaths in this group.
This is down 9% compared to Old Normal rates. Those rates, applied to this year's population of 403,162 people aged 45-49, would have predicted 629 deaths from Unknown Causes this year.
This means there were 53 fewer deaths than expected from Unknown Causes among people aged 45-49 living in Massachusetts in 2022.
Overall, 5,217 deaths from Unknown Causes represent 224 lives saved among people aged 45-49 over the first 8 years of Massachusetts's New Normal™.
Click the bar graph above to see how the both the 2022 total of 53 fewer and the 8 year total of 5,217 fewer individual aged 45-49 deaths from Unknown Causes is arrived at.
Yearly Unknown Causes Tally: 2,615 / 16,394
The next 817 of the 16,394 individual deaths from Unknown Causes in 2022 were among people aged 50-54, accounting for 44.07% of the 1,854 total deaths in this group.
This is down 4% compared to Old Normal rates. Those rates, applied to this year's population of 452,841 people aged 50-54, would have predicted 848 deaths from Unknown Causes this year.
This means there were 31 fewer deaths than expected from Unknown Causes among people aged 50-54 living in Massachusetts in 2022.
Overall, 6,847 deaths from Unknown Causes represent 295 lives saved among people aged 50-54 over the first 8 years of Massachusetts's New Normal™.
Click the bar graph above to see how the both the 2022 total of 31 fewer and the 8 year total of 6,847 fewer individual aged 50-54 deaths from Unknown Causes is arrived at.
Yearly Unknown Causes Tally: 3,432 / 16,394
The next 1,210 of the 16,394 individual deaths from Unknown Causes in 2022 were among people aged 55-59, accounting for 40.50% of the 2,988 total deaths in this group.
This is up 5% compared to Old Normal rates. Those rates, applied to this year's population of 479,734 people aged 55-59, would have predicted 1,152 deaths from Unknown Causes this year.
This means there were 58 more deaths than expected from Unknown Causes among people aged 55-59 living in Massachusetts in 2022.
Overall, 9,300 deaths from Unknown Causes represent 106 lives saved among people aged 55-59 over the first 8 years of Massachusetts's New Normal™.
Click the bar graph above to see how the both the 2022 total of 58 more and the 8 year total of 9,300 more individual aged 55-59 deaths from Unknown Causes is arrived at.
Yearly Unknown Causes Tally: 4,642 / 16,394
The next 1,373 of the 16,394 individual deaths from Unknown Causes in 2022 were among people aged 60-64, accounting for 33.08% of the 4,150 total deaths in this group.
This is down 9% compared to Old Normal rates. Those rates, applied to this year's population of 471,620 people aged 60-64, would have predicted 1,496 deaths from Unknown Causes this year.
This means there were 123 fewer deaths than expected from Unknown Causes among people aged 60-64 living in Massachusetts in 2022.
Overall, 10,210 deaths from Unknown Causes represent 1,149 lives saved among people aged 60-64 over the first 8 years of Massachusetts's New Normal™.
Click the bar graph above to see how the both the 2022 total of 123 fewer and the 8 year total of 10,210 fewer individual aged 60-64 deaths from Unknown Causes is arrived at.
Yearly Unknown Causes Tally: 6,015 / 16,394
The next 1,482 of the 16,394 individual deaths from Unknown Causes in 2022 were among elderly men and women aged 65-69, accounting for 28.98% of the 5,114 total deaths in this group.
This is down 15% compared to Old Normal rates. Those rates, applied to this year's population of 405,281 elderly men and women aged 65-69, would have predicted 1,748 deaths from Unknown Causes this year.
This means there were 266 fewer deaths than expected from Unknown Causes among elderly men and women aged 65-69 living in Massachusetts in 2022.
Overall, 11,399 deaths from Unknown Causes represent 1,531 lives saved among elderly men and women aged 65-69 over the first 8 years of Massachusetts's New Normal™.
Click the bar graph above to see how the both the 2022 total of 266 fewer and the 8 year total of 11,399 fewer individual aged 65-69 deaths from Unknown Causes is arrived at.
Yearly Unknown Causes Tally: 7,497 / 16,394
The next 1,650 of the 16,394 individual deaths from Unknown Causes in 2022 were among elderly men and women aged 70-74, accounting for 25.87% of the 6,377 total deaths in this group.
This is down 13% compared to Old Normal rates. Those rates, applied to this year's population of 326,263 elderly men and women aged 70-74, would have predicted 1,897 deaths from Unknown Causes this year.
This means there were 247 fewer deaths than expected from Unknown Causes among elderly men and women aged 70-74 living in Massachusetts in 2022.
Overall, 11,988 deaths from Unknown Causes represent 1,494 lives saved among elderly men and women aged 70-74 over the first 8 years of Massachusetts's New Normal™.
Click the bar graph above to see how the both the 2022 total of 247 fewer and the 8 year total of 11,988 fewer individual aged 70-74 deaths from Unknown Causes is arrived at.
Yearly Unknown Causes Tally: 9,147 / 16,394
The next 1,678 of the 16,394 individual deaths from Unknown Causes in 2022 were among elderly men and women aged 75-79, accounting for 21.63% of the 7,756 total deaths in this group.
This is down 5% compared to Old Normal rates. Those rates, applied to this year's population of 235,432 elderly men and women aged 75-79, would have predicted 1,761 deaths from Unknown Causes this year.
This means there were 83 fewer deaths than expected from Unknown Causes among elderly men and women aged 75-79 living in Massachusetts in 2022.
Overall, 11,878 deaths from Unknown Causes represent 94 lives lost among elderly men and women aged 75-79 over the first 8 years of Massachusetts's New Normal™.
Click the bar graph above to see how the both the 2022 total of 83 fewer and the 8 year total of 11,878 fewer individual aged 75-79 deaths from Unknown Causes is arrived at.
Yearly Unknown Causes Tally: 10,825 / 16,394
The next 1,456 of the 16,394 individual deaths from Unknown Causes in 2022 were among elderly men and women aged 80-84, accounting for 17.96% of the 8,105 total deaths in this group.
This is up 0% compared to Old Normal rates. Those rates, applied to this year's population of 142,668 elderly men and women aged 80-84, would have predicted 1,451 deaths from Unknown Causes this year.
This means there were 5 more deaths than expected from Unknown Causes among elderly men and women aged 80-84 living in Massachusetts in 2022.
Overall, 11,693 deaths from Unknown Causes represent 820 lives lost among elderly men and women aged 80-84 over the first 8 years of Massachusetts's New Normal™.
Click the bar graph above to see how the both the 2022 total of 5 more and the 8 year total of 11,693 more individual aged 80-84 deaths from Unknown Causes is arrived at.
Yearly Unknown Causes Tally: 12,281 / 16,394
The next 5,569 of the 16,394 deaths from Unknown Causes in 2022 were among elderly men and women aged 80+, accounting for 18.36% of the 30,325 total deaths in this group.
This is up 11% compared to Old Normal rates which, when applied to this year's population of 142,668 would have predicted 5,012 deaths from Unknown Causes this year.
This means there were 557 more deaths than expected from Unknown Causes among elderly men and women aged 80+ living in Massachusetts in 2022.
Overall, 44,926 deaths from Unknown Causes represent 7,374 lives lost among elderly men and women aged 80+ over the first 8 years of Massachusetts's New Normal™.
Click the bar graph above to see how the 8 year total of 44,926 excess individual deaths from Unknown Causes is arrived at.
Yearly Unknown Causes Tally: 17,850 / 16,394*
* Massachusetts does not report the deaths of 1,456 babies in it's death totals