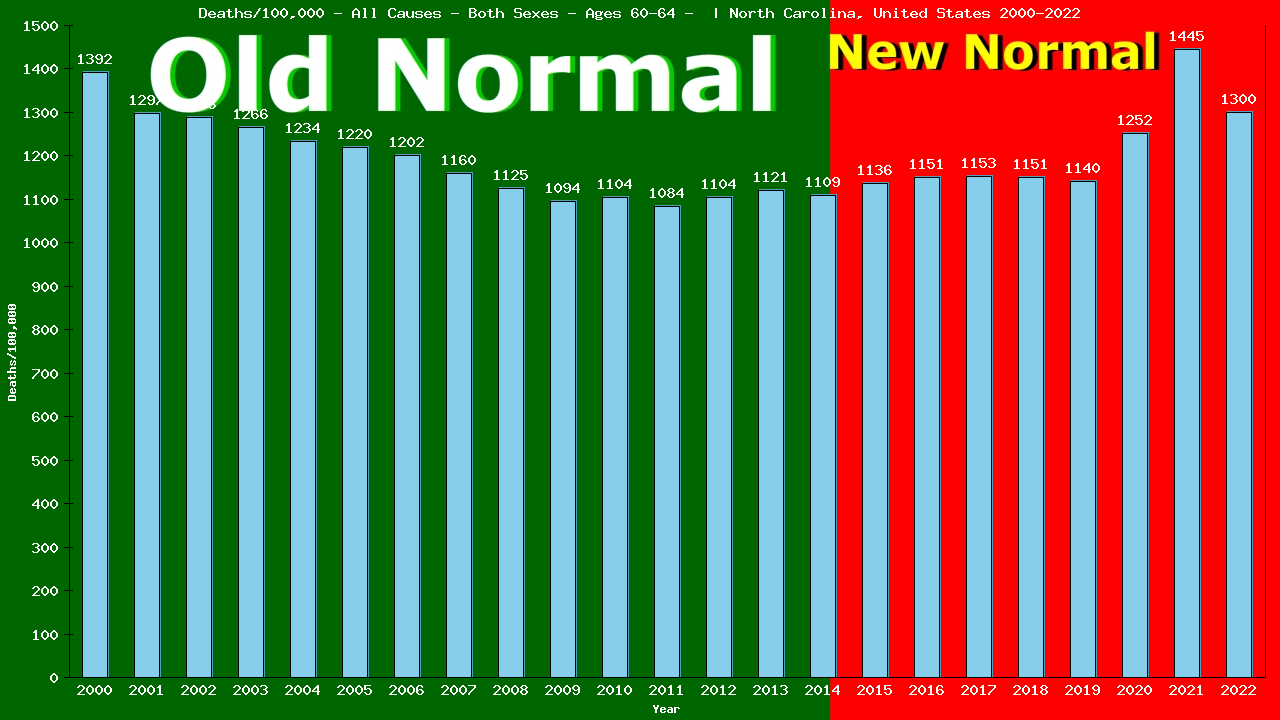
2022 vs New Normal™ for people aged 60-64 in North Carolina
8,842 of 8,842 total deaths were from All Causes
100.00% of all deaths were from All Causes
This is up 11% compared to Old Normal rates.
7,956 of 7,956 total deaths would have been expected under Old Normal conditions.
886 more deaths from All Causes in 2022.
2,562 more deaths from All Causes (2015-2022)
To show this year’s deaths from All Causes are up 11% compared to Old Normal rates, we need to calculate the rates for both 2022 and for the Old Normal.
Remember, death rates are calculated to answer these questions:
“How many people aged 60-64 were there?” and
“How many of them died from All Causes?”
The following 2 charts provide this information:
Deaths – All Causes – Male – Aged 60-64 | North Carolina, United-states
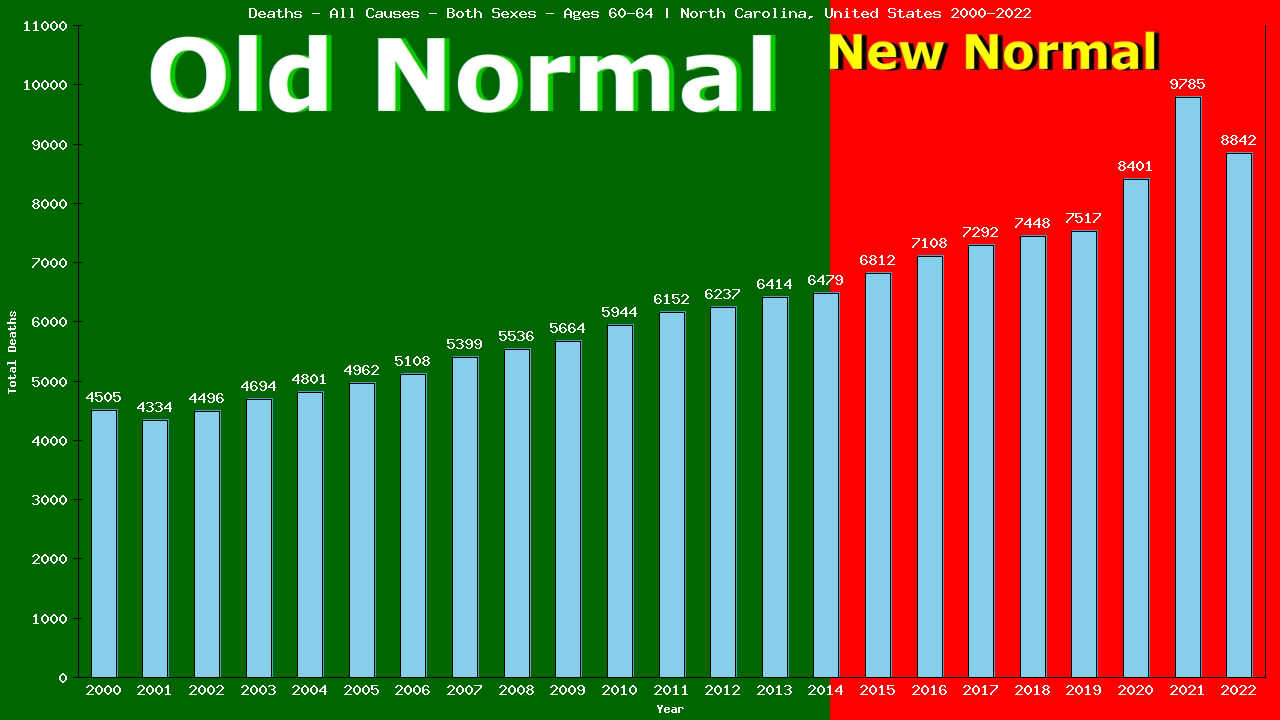
Populalation – Male – Aged 60-64 – [2000-2022] | North Carolina, United-states
From the charts, we can see that in 2022, 8,842 of 679,846 people aged 60-64 living in North Carolina died from All Causes.
8,842 ÷ 679,846 = 0.01301 (2022 CDR)
We’ll use the table below to calculate our Old Normal rate for deaths from All Causes
Old Normal (2001-2014) North Carolina male aged 60-64 All Causes
Year
Pop
Died
From
|2000
323,505
4,505
4,505
|2001
334,000
4,334
4,334
|2002
348,965
4,496
4,496
|2003
370,569
4,694
4,694
|2004
389,005
4,801
4,801
|Year
Pop
Died
From
|2005
406,669
4,962
4,962
|2006
424,867
5,108
5,108
|2007
465,131
5,399
5,399
|2008
491,700
5,536
5,536
|2009
517,272
5,664
5,664
|Year
Pop
Died
From
|2010
538,039
5,944
5,944
|2011
567,321
6,152
6,152
|2012
564,905
6,237
6,237
|2013
571,798
6,414
6,414
|2014
584,219
6,479
6,479
Cumulative:
Population
Deaths
All Causes
Totals:
6,897,965
80,725
80,725
The table shows there were a total of 80,725 deaths from All Causes among 6,897,965 people aged 60-64 living in North Carolina in the 15 years immediately prior to the New Normal™.
80,725 ÷ 6,897,965 = 0.01170 (Old Normal CDR)
We can use the Old Normal rate to predict this year’s deaths:
2022 pop X Old Normal CDR = expected deaths
679,846 X 0.01170 = 7,956 expected deaths
The difference between actual and expected deaths shows lives saved or lost:
8,842 – 7,956 = 886
Dividing the actual deaths by the expected deaths gives us the comparative rates:
8,842 ÷ 7,956 = 1.1104
This reveals 886 lives lost and is 111.04% of what we expected (an increase of 11%) in deaths from All Causes among people aged 60-64 living in North Carolina in 2022, as compared to the Old Normal.
Compare our Old Normal to the 5yr CDR. Does it tell the same story your TV does?
5yr CDR (2017-2021)
Year
Pop
Died
From
|2017
632,263
7,292
7,292
|2018
647,013
7,448
7,448
|2019
658,831
7,517
7,517
|2020
670,505
8,401
8,401
|2021
676,803
9,785
9,785
Total:
4,502,090
54,363
54,363
This is the same method used by Public Health to calculate the 5-yr CDR (Cumulative Death Rate):
54,363 ÷ 4,502,090 = 0.01208 (5-yr CDR)
679,846(2022 pop) X 0.01208 = 8,209 expected deaths
The difference between actual and expected deaths:
8,842 – 8,209 = 633 or 633 lives lost
Divide actual deaths by expected deaths:
8,842 ÷ 8,209 = 1.0762 or an increase of 8%
for deaths from All Causes among people aged 60-64 living in North Carolina in 2022, as compared to the previous 5 years.
Finally, the same method can also be used to compare our Old Normal rate to the New Normal™ rate:
New Normal™ population X Old Normal rate = expected deaths
5,181,936 X 0.01170 = 60,643 expected deaths
The difference between actual and expected deaths:
63205 – 60,643 = 2,562 or 2,562 lives lost
Dividing the actual deaths by the expected deaths:
63,205 ÷ 60,643 = 1.0414 or an increase of 4%
in deaths from All Causes among people aged 60-64 living in North Carolina in the New Normal™, as compared to the Old Normal.
New Normal (2015-2022)
Year
Pop
Died
From
|2015
599,586
6,812
6,812
|2016
617,089
7,108
7,108
|2017
632,263
7,292
7,292
|2018
647,013
7,448
7,448
|2019
658,831
7,517
7,517
|2020
670,505
8,401
8,401
|2021
676,803
9,785
9,785
|2022
679,846
8,842
8,842
Total:
5,181,936
63,205
63,205
The world has been led to believe that a deadly pandemic swept the globe beginning in 2020, causing an increase in death rates, especially among the elderly
The data show that death rates began to increase in 2015, immediately upon implementation of the UN’s 2030 Agenda for Sustainable Development, that young adults have experienced ever-increasing death rates since, and that death rates among the elderly have remained relatively stable.
Browse through the age-categorized charts below to see the evidence of this. Click on any chart to see the full analysis for each age group.
112,921 of the 112,921 deaths among individuals of all ages living in North Carolina in 2022 were from All Causes (100.00% of all deaths).
This is up 25% compared to Old Normal (2000-2014) rates which, when applied to the this year's both sexes population of 10,511,943 individuals would have predicted 90,333 deaths from All Causes.
This means there were 22,588 more deaths than expected from All Causes among individuals of all ages living in North Carolina in 2022.
To date, 100,680 individual lives have been lost to All Causes over the first 8 years of North Carolina's New Normal™.
Browse through the age categories below to learn how these deaths from All Causes in 2022 are distributed among each age group of individuals in North Carolina.
Click the bar graph above to see how both the 2022 loss of 22,588 lives and the 8-year loss of 100,680 individual lives from All Causes is arrived at.
The first 826 of the 112,921 deaths from All Causes in 2022 were among babies in their first year of life, accounting for 100.00% of the 826 total deaths in this group.
This is down 16% compared to Old Normal rates which, when applied to this year's population of 121,554 babies in their first year of life, would have predicted 983 deaths from All Causes this year.
This means there were 157 fewer deaths than expected from All Causes among babies in their first year of life living in North Carolina in 2022.
Overall, 6,646 deaths from All Causes represent 1,056 lives saved among babies in their first year of life over the first 8 years of North Carolina's New Normal™.
Click the bar graph above to see how both the 2022 total of 157 fewer live lost than expected and the 8 year total of 6646 lives saved from All Causes among babies in their first year of life is arrived at.
Yearly All Causes Tally: 826 / 112,921
The next 190 of the 112,921 individual deaths from All Causes in 2022 were among pre-schoolers aged 1-4, accounting for 99.99% of the 190 total deaths in this group.
This is up 32% compared to Old Normal rates. Those rates, applied to this year's population of 474,936 pre-schoolers aged 1-4, would have predicted 139 deaths from All Causes this year.
This means there were 51 more deaths than expected from All Causes among pre-schoolers aged 1-4 living in North Carolina in 2022.
Overall, 1,069 deaths from All Causes represent 71 lives saved among pre-schoolers aged 1-4 over the first 8 years of North Carolina's New Normal™.
Click the bar graph above to see how the both the 2022 total of 51 more and the 8 year total of 1,069 more individual aged 1-4 deaths from All Causes is arrived at.
Yearly All Causes Tally: 1,016 / 112,921
The next 97 of the 112,921 individual deaths from All Causes in 2022 were among children aged 5-9, accounting for 99.99% of the 97 total deaths in this group.
This is up 1% compared to Old Normal rates. Those rates, applied to this year's population of 623,783 children aged 5-9, would have predicted 92 deaths from All Causes this year.
This means there were 5 more deaths than expected from All Causes among children aged 5-9 living in North Carolina in 2022.
Overall, 649 deaths from All Causes represent 93 lives saved among children aged 5-9 over the first 8 years of North Carolina's New Normal™.
Click the bar graph above to see how the both the 2022 total of 5 more and the 8 year total of 649 more individual aged 5-9 deaths from All Causes is arrived at.
Yearly All Causes Tally: 1,113 / 112,921
The next 149 of the 112,921 individual deaths from All Causes in 2022 were among children aged 10-14, accounting for 99.99% of the 149 total deaths in this group.
This is up 20% compared to Old Normal rates. Those rates, applied to this year's population of 660,316 children aged 10-14, would have predicted 117 deaths from All Causes this year.
This means there were 32 more deaths than expected from All Causes among children aged 10-14 living in North Carolina in 2022.
Overall, 888 deaths from All Causes represent 52 lives saved among children aged 10-14 over the first 8 years of North Carolina's New Normal™.
Click the bar graph above to see how the both the 2022 total of 32 more and the 8 year total of 888 more individual aged 10-14 deaths from All Causes is arrived at.
Yearly All Causes Tally: 1,262 / 112,921
The next 481 of the 112,921 individual deaths from All Causes in 2022 were among teens aged 15-19, accounting for 100.00% of the 481 total deaths in this group.
This is up 6% compared to Old Normal rates. Those rates, applied to this year's population of 705,170 teens aged 15-19, would have predicted 445 deaths from All Causes this year.
This means there were 36 more deaths than expected from All Causes among teens aged 15-19 living in North Carolina in 2022.
Overall, 3,195 deaths from All Causes represent 258 lives saved among teens aged 15-19 over the first 8 years of North Carolina's New Normal™.
Click the bar graph above to see how the both the 2022 total of 36 more and the 8 year total of 3,195 more individual aged 15-19 deaths from All Causes is arrived at.
Yearly All Causes Tally: 1,743 / 112,921
The next 906 of the 112,921 individual deaths from All Causes in 2022 were among people aged 20-24, accounting for 100.00% of the 906 total deaths in this group.
This is up 21% compared to Old Normal rates. Those rates, applied to this year's population of 747,739 people aged 20-24, would have predicted 741 deaths from All Causes this year.
This means there were 165 more deaths than expected from All Causes among people aged 20-24 living in North Carolina in 2022.
Overall, 6,416 deaths from All Causes represent 799 lives lost among people aged 20-24 over the first 8 years of North Carolina's New Normal™.
Click the bar graph above to see how the both the 2022 total of 165 more and the 8 year total of 6,416 more individual aged 20-24 deaths from All Causes is arrived at.
Yearly All Causes Tally: 2,649 / 112,921
The next 1,291 of the 112,921 individual deaths from All Causes in 2022 were among people aged 25-29, accounting for 100.00% of the 1,291 total deaths in this group.
This is up 69% compared to Old Normal rates. Those rates, applied to this year's population of 703,747 people aged 25-29, would have predicted 759 deaths from All Causes this year.
This means there were 532 more deaths than expected from All Causes among people aged 25-29 living in North Carolina in 2022.
Overall, 8,564 deaths from All Causes represent 2,449 lives lost among people aged 25-29 over the first 8 years of North Carolina's New Normal™.
Click the bar graph above to see how the both the 2022 total of 532 more and the 8 year total of 8,564 more individual aged 25-29 deaths from All Causes is arrived at.
Yearly All Causes Tally: 3,940 / 112,921
The next 1,662 of the 112,921 individual deaths from All Causes in 2022 were among people aged 30-34, accounting for 100.00% of the 1,662 total deaths in this group.
This is up 84% compared to Old Normal rates. Those rates, applied to this year's population of 733,732 people aged 30-34, would have predicted 895 deaths from All Causes this year.
This means there were 767 more deaths than expected from All Causes among people aged 30-34 living in North Carolina in 2022.
Overall, 9,943 deaths from All Causes represent 3,307 lives lost among people aged 30-34 over the first 8 years of North Carolina's New Normal™.
Click the bar graph above to see how the both the 2022 total of 767 more and the 8 year total of 9,943 more individual aged 30-34 deaths from All Causes is arrived at.
Yearly All Causes Tally: 5,602 / 112,921
The next 1,799 of the 112,921 individual deaths from All Causes in 2022 were among people aged 35-39, accounting for 100.00% of the 1,799 total deaths in this group.
This is up 60% compared to Old Normal rates. Those rates, applied to this year's population of 681,251 people aged 35-39, would have predicted 1,115 deaths from All Causes this year.
This means there were 684 more deaths than expected from All Causes among people aged 35-39 living in North Carolina in 2022.
Overall, 11,458 deaths from All Causes represent 2,832 lives lost among people aged 35-39 over the first 8 years of North Carolina's New Normal™.
Click the bar graph above to see how the both the 2022 total of 684 more and the 8 year total of 11,458 more individual aged 35-39 deaths from All Causes is arrived at.
Yearly All Causes Tally: 7,401 / 112,921
The next 2,240 of the 112,921 individual deaths from All Causes in 2022 were among people aged 40-44, accounting for 100.00% of the 2,240 total deaths in this group.
This is up 38% compared to Old Normal rates. Those rates, applied to this year's population of 670,100 people aged 40-44, would have predicted 1,621 deaths from All Causes this year.
This means there were 619 more deaths than expected from All Causes among people aged 40-44 living in North Carolina in 2022.
Overall, 14,163 deaths from All Causes represent 1,563 lives lost among people aged 40-44 over the first 8 years of North Carolina's New Normal™.
Click the bar graph above to see how the both the 2022 total of 619 more and the 8 year total of 14,163 more individual aged 40-44 deaths from All Causes is arrived at.
Yearly All Causes Tally: 9,641 / 112,921
The next 2,716 of the 112,921 individual deaths from All Causes in 2022 were among people aged 45-49, accounting for 100.00% of the 2,716 total deaths in this group.
This is up 12% compared to Old Normal rates. Those rates, applied to this year's population of 645,257 people aged 45-49, would have predicted 2,410 deaths from All Causes this year.
This means there were 306 more deaths than expected from All Causes among people aged 45-49 living in North Carolina in 2022.
Overall, 19,939 deaths from All Causes represent 308 lives saved among people aged 45-49 over the first 8 years of North Carolina's New Normal™.
Click the bar graph above to see how the both the 2022 total of 306 more and the 8 year total of 19,939 more individual aged 45-49 deaths from All Causes is arrived at.
Yearly All Causes Tally: 12,357 / 112,921
The next 4,275 of the 112,921 individual deaths from All Causes in 2022 were among people aged 50-54, accounting for 100.00% of the 4,275 total deaths in this group.
This is up 9% compared to Old Normal rates. Those rates, applied to this year's population of 701,701 people aged 50-54, would have predicted 3,929 deaths from All Causes this year.
This means there were 346 more deaths than expected from All Causes among people aged 50-54 living in North Carolina in 2022.
Overall, 31,036 deaths from All Causes represent 143 lives lost among people aged 50-54 over the first 8 years of North Carolina's New Normal™.
Click the bar graph above to see how the both the 2022 total of 346 more and the 8 year total of 31,036 more individual aged 50-54 deaths from All Causes is arrived at.
Yearly All Causes Tally: 16,632 / 112,921
The next 6,177 of the 112,921 individual deaths from All Causes in 2022 were among people aged 55-59, accounting for 100.00% of the 6,177 total deaths in this group.
This is up 12% compared to Old Normal rates. Those rates, applied to this year's population of 687,962 people aged 55-59, would have predicted 5,501 deaths from All Causes this year.
This means there were 676 more deaths than expected from All Causes among people aged 55-59 living in North Carolina in 2022.
Overall, 47,429 deaths from All Causes represent 3,190 lives lost among people aged 55-59 over the first 8 years of North Carolina's New Normal™.
Click the bar graph above to see how the both the 2022 total of 676 more and the 8 year total of 47,429 more individual aged 55-59 deaths from All Causes is arrived at.
Yearly All Causes Tally: 22,809 / 112,921
The next 8,842 of the 112,921 individual deaths from All Causes in 2022 were among people aged 60-64, accounting for 100.00% of the 8,842 total deaths in this group.
This is up 11% compared to Old Normal rates. Those rates, applied to this year's population of 679,846 people aged 60-64, would have predicted 7,956 deaths from All Causes this year.
This means there were 886 more deaths than expected from All Causes among people aged 60-64 living in North Carolina in 2022.
Overall, 63,205 deaths from All Causes represent 2,562 lives lost among people aged 60-64 over the first 8 years of North Carolina's New Normal™.
Click the bar graph above to see how the both the 2022 total of 886 more and the 8 year total of 63,205 more individual aged 60-64 deaths from All Causes is arrived at.
Yearly All Causes Tally: 31,651 / 112,921
The next 10,725 of the 112,921 individual deaths from All Causes in 2022 were among elderly men and women aged 65-69, accounting for 100.00% of the 10,725 total deaths in this group.
This is up 1% compared to Old Normal rates. Those rates, applied to this year's population of 605,454 elderly men and women aged 65-69, would have predicted 10,635 deaths from All Causes this year.
This means there were 90 more deaths than expected from All Causes among elderly men and women aged 65-69 living in North Carolina in 2022.
Overall, 76,026 deaths from All Causes represent 3,970 lives saved among elderly men and women aged 65-69 over the first 8 years of North Carolina's New Normal™.
Click the bar graph above to see how the both the 2022 total of 90 more and the 8 year total of 76,026 more individual aged 65-69 deaths from All Causes is arrived at.
Yearly All Causes Tally: 42,376 / 112,921
The next 12,950 of the 112,921 individual deaths from All Causes in 2022 were among elderly men and women aged 70-74, accounting for 100.00% of the 12,950 total deaths in this group.
This is down 5% compared to Old Normal rates. Those rates, applied to this year's population of 501,124 elderly men and women aged 70-74, would have predicted 13,615 deaths from All Causes this year.
This means there were 665 fewer deaths than expected from All Causes among elderly men and women aged 70-74 living in North Carolina in 2022.
Overall, 89,936 deaths from All Causes represent 8,512 lives saved among elderly men and women aged 70-74 over the first 8 years of North Carolina's New Normal™.
Click the bar graph above to see how the both the 2022 total of 665 fewer and the 8 year total of 89,936 fewer individual aged 70-74 deaths from All Causes is arrived at.
Yearly All Causes Tally: 55,326 / 112,921
The next 14,557 of the 112,921 individual deaths from All Causes in 2022 were among elderly men and women aged 75-79, accounting for 100.00% of the 14,557 total deaths in this group.
This is down 6% compared to Old Normal rates. Those rates, applied to this year's population of 359,363 elderly men and women aged 75-79, would have predicted 15,449 deaths from All Causes this year.
This means there were 892 fewer deaths than expected from All Causes among elderly men and women aged 75-79 living in North Carolina in 2022.
Overall, 96,136 deaths from All Causes represent 8,648 lives saved among elderly men and women aged 75-79 over the first 8 years of North Carolina's New Normal™.
Click the bar graph above to see how the both the 2022 total of 892 fewer and the 8 year total of 96,136 fewer individual aged 75-79 deaths from All Causes is arrived at.
Yearly All Causes Tally: 69,883 / 112,921
The next 14,452 of the 112,921 individual deaths from All Causes in 2022 were among elderly men and women aged 80-84, accounting for 100.00% of the 14,452 total deaths in this group.
This is down 1% compared to Old Normal rates. Those rates, applied to this year's population of 208,908 elderly men and women aged 80-84, would have predicted 14,612 deaths from All Causes this year.
This means there were 160 fewer deaths than expected from All Causes among elderly men and women aged 80-84 living in North Carolina in 2022.
Overall, 101,113 deaths from All Causes represent 7,207 lives saved among elderly men and women aged 80-84 over the first 8 years of North Carolina's New Normal™.
Click the bar graph above to see how the both the 2022 total of 160 fewer and the 8 year total of 101,113 fewer individual aged 80-84 deaths from All Causes is arrived at.
Yearly All Causes Tally: 84,335 / 112,921
The next 43,038 of the 112,921 deaths from All Causes in 2022 were among elderly men and women aged 80+, accounting for 100.00% of the 43,038 total deaths in this group.
This is up 4% compared to Old Normal rates which, when applied to this year's population of 208,908 would have predicted 41,512 deaths from All Causes this year.
This means there were 1,526 more deaths than expected from All Causes among elderly men and women aged 80+ living in North Carolina in 2022.
Overall, 316,256 deaths from All Causes represent 8,519 lives lost among elderly men and women aged 80+ over the first 8 years of North Carolina's New Normal™.
Click the bar graph above to see how the 8 year total of 316,256 excess individual deaths from All Causes is arrived at.
Yearly All Causes Tally: 127,373 / 112,921*
* North Carolina does not report the deaths of 14,452 babies in it's death totals