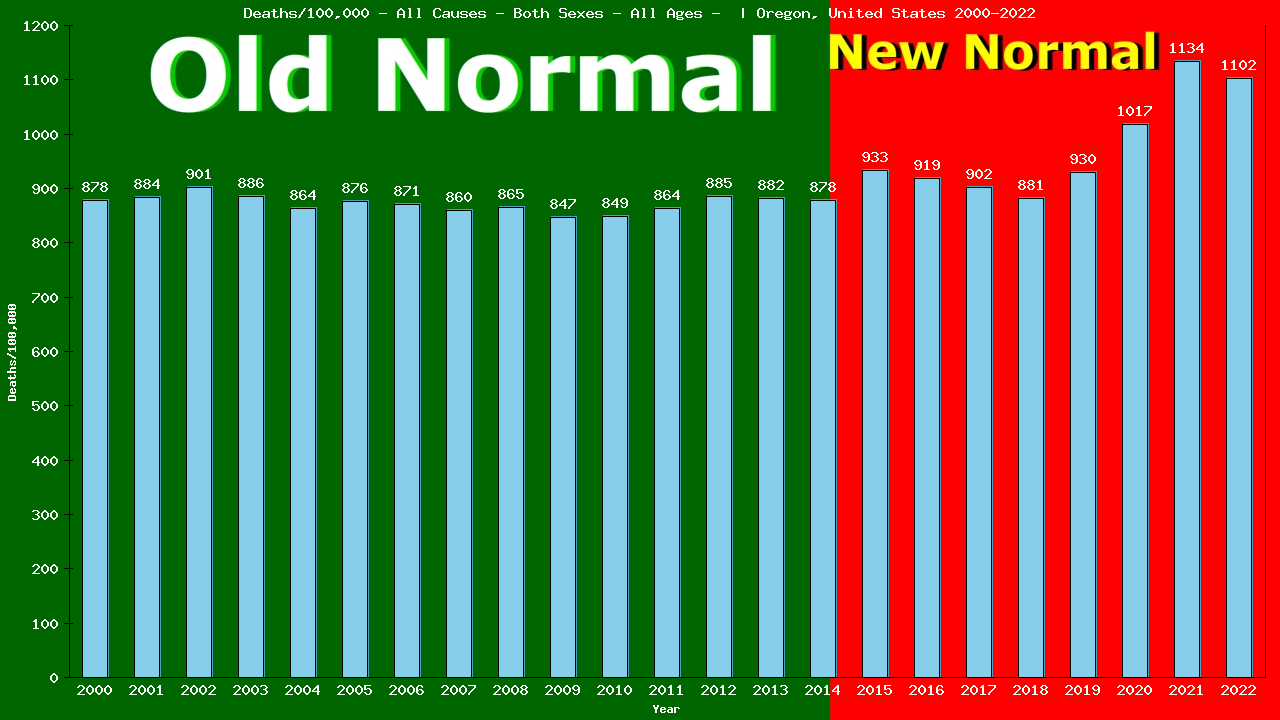
2022 vs New Normal™ for individuals of all ages in Oregon
44,590 of 44,590 total deaths were from All Causes
100.00% of all deaths were from All Causes
This is up 26% compared to Old Normal rates.
35,306 of 35,306 total deaths would have been expected under Old Normal conditions.
9,284 more deaths from All Causes in 2022.
33,346 more deaths from All Causes (2015-2022)
To show this year’s deaths from All Causes are up 26% compared to Old Normal rates, we need to calculate the rates for both 2022 and for the Old Normal.
Remember, death rates are calculated to answer these questions:
“How many individuals of all ages were there?” and
“How many of them died from All Causes?”
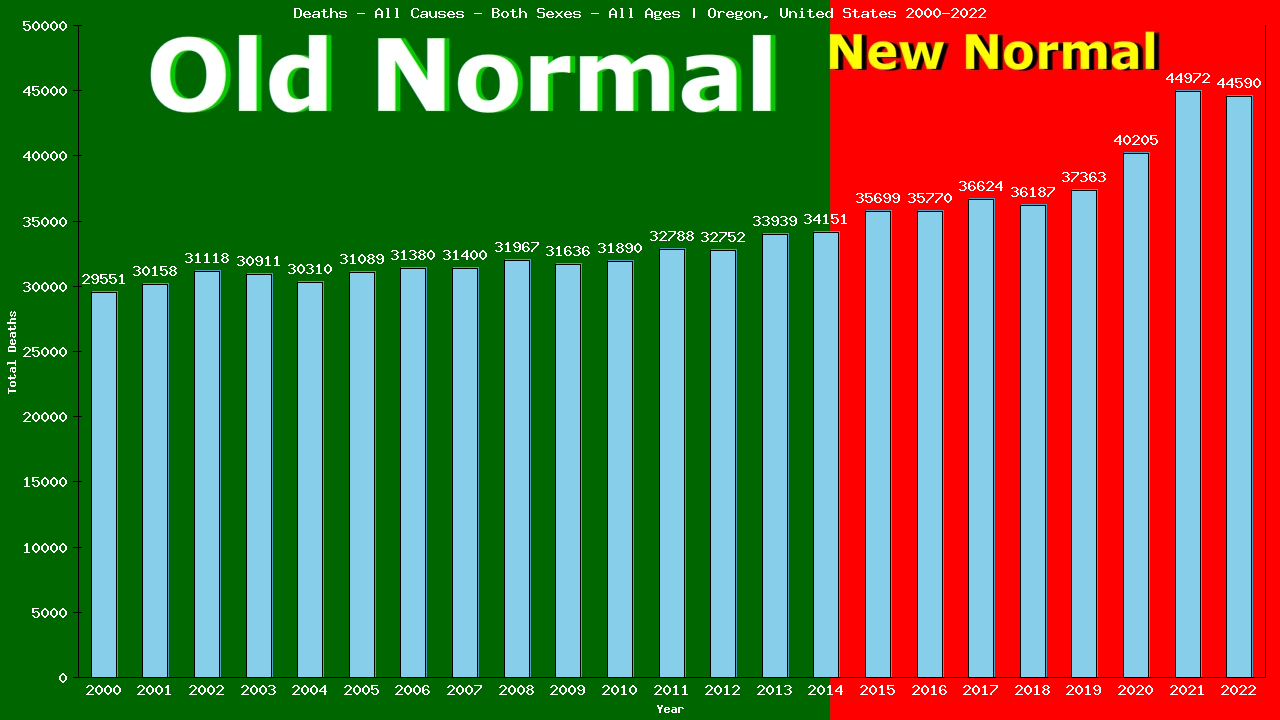
The following 2 charts provide this information:
Deaths – All Causes – Both Sexes – Of All Ages | Oregon, United-states
Populalation – Both Sexes – Of All Ages – [2000-2022] | Oregon, United-states
From the charts, we can see that in 2022, 44,590 of 4,044,723 individuals of all ages living in Oregon died from All Causes.
44,590 ÷ 4,044,723 = 0.01102 (2022 CDR)
We’ll use the table below to calculate our Old Normal rate for deaths from All Causes
Old Normal (2001-2014) Oregon both sexes of all ages All Causes
Year
Pop
Died
From
|2000
3,363,968
29,551
29,551
|2001
3,408,709
30,158
30,158
|2002
3,452,924
31,118
31,118
|2003
3,484,954
30,911
30,911
|2004
3,505,304
30,310
30,310
|Year
Pop
Died
From
|2005
3,547,067
31,089
31,089
|2006
3,601,826
31,380
31,380
|2007
3,650,810
31,400
31,400
|2008
3,694,769
31,967
31,967
|2009
3,732,264
31,636
31,636
|Year
Pop
Died
From
|2010
3,753,202
31,890
31,890
|2011
3,790,862
32,788
32,788
|2012
3,700,394
32,752
32,752
|2013
3,847,243
33,939
33,939
|2014
3,886,699
34,151
34,151
Cumulative:
Population
Deaths
All Causes
Totals:
54,420,995
475,040
475,040
The table shows there were a total of 475,040 deaths from All Causes among 54,420,995 individuals of all ages living in Oregon in the 15 years immediately prior to the New Normal™.
475,040 ÷ 54,420,995 = 0.00873 (Old Normal CDR)
We can use the Old Normal rate to predict this year’s deaths:
2022 pop X Old Normal CDR = expected deaths
4,044,723 X 0.00873 = 35,306 expected deaths
The difference between actual and expected deaths shows lives saved or lost:
44,590 – 35,306 = 9,284
Dividing the actual deaths by the expected deaths gives us the comparative rates:
44,590 ÷ 35,306 = 1.2615
This reveals 9,284 lives lost and is 126.15% of what we expected (an increase of 26%) in deaths from All Causes among individuals of all ages living in Oregon in 2022, as compared to the Old Normal.
Compare our Old Normal to the 5yr CDR. Does it tell the same story your TV does?
5yr CDR (2017-2021)
Year
Pop
Died
From
|2017
4,059,341
36,624
36,624
|2018
4,106,688
36,187
36,187
|2019
4,014,837
37,363
37,363
|2020
3,951,899
40,205
40,205
|2021
3,962,492
44,972
44,972
Total:
27,810,497
266,820
266,820
This is the same method used by Public Health to calculate the 5-yr CDR (Cumulative Death Rate):
266,820 ÷ 27,810,497 = 0.00959 (5-yr CDR)
4,044,723(2022 pop) X 0.00959 = 38,806 expected deaths
The difference between actual and expected deaths:
44,590 – 38,806 = 5,784 or 5,784 lives lost
Divide actual deaths by expected deaths:
44,590 ÷ 38,806 = 1.1479 or an increase of 15%
for deaths from All Causes among individuals of all ages living in Oregon in 2022, as compared to the previous 5 years.
Finally, the same method can also be used to compare our Old Normal rate to the New Normal™ rate:
New Normal™ population X Old Normal rate = expected deaths
31,855,220 X 0.00873 = 278,064 expected deaths
The difference between actual and expected deaths:
311410 – 278,064 = 33,346 or 33,346 lives lost
Dividing the actual deaths by the expected deaths:
311,410 ÷ 278,064 = 1.1186 or an increase of 12%
in deaths from All Causes among individuals of all ages living in Oregon in the New Normal™, as compared to the Old Normal.
New Normal (2015-2022)
Year
Pop
Died
From
|2015
3,825,948
35,699
35,699
|2016
3,889,292
35,770
35,770
|2017
4,059,341
36,624
36,624
|2018
4,106,688
36,187
36,187
|2019
4,014,837
37,363
37,363
|2020
3,951,899
40,205
40,205
|2021
3,962,492
44,972
44,972
|2022
4,044,723
44,590
44,590
Total:
31,855,220
311,410
311,410
The world has been led to believe that a deadly pandemic swept the globe beginning in 2020, causing an increase in death rates, especially among the elderly
The data show that death rates began to increase in 2015, immediately upon implementation of the UN’s 2030 Agenda for Sustainable Development, that young adults have experienced ever-increasing death rates since, and that death rates among the elderly have remained relatively stable.
Browse through the age-categorized charts below to see the evidence of this. Click on any chart to see the full analysis for each age group.
44,590 of the 44,590 deaths among individuals of all ages living in Oregon in 2022 were from All Causes (100.00% of all deaths).
This is up 26% compared to Old Normal (2000-2014) rates which, when applied to the this year's both sexes population of 4,044,723 individuals would have predicted 35,306 deaths from All Causes.
This means there were 9,284 more deaths than expected from All Causes among individuals of all ages living in Oregon in 2022.
To date, 33,346 individual lives have been lost to All Causes over the first 8 years of Oregon's New Normal™.
Browse through the age categories below to learn how these deaths from All Causes in 2022 are distributed among each age group of individuals in Oregon.
Click the bar graph above to see how both the 2022 loss of 9,284 lives and the 8-year loss of 33,346 individual lives from All Causes is arrived at.
The first 177 of the 44,590 deaths from All Causes in 2022 were among babies in their first year of life, accounting for 99.99% of the 177 total deaths in this group.
This is down 20% compared to Old Normal rates which, when applied to this year's population of 41,052 babies in their first year of life, would have predicted 221 deaths from All Causes this year.
This means there were 44 fewer deaths than expected from All Causes among babies in their first year of life living in Oregon in 2022.
Overall, 1,558 deaths from All Causes represent 332 lives saved among babies in their first year of life over the first 8 years of Oregon's New Normal™.
Click the bar graph above to see how both the 2022 total of 44 fewer live lost than expected and the 8 year total of 1558 lives saved from All Causes among babies in their first year of life is arrived at.
Yearly All Causes Tally: 177 / 44,590
The next 35 of the 44,590 individual deaths from All Causes in 2022 were among pre-schoolers aged 1-4, accounting for 99.97% of the 35 total deaths in this group.
This is down 21% compared to Old Normal rates. Those rates, applied to this year's population of 165,022 pre-schoolers aged 1-4, would have predicted 43 deaths from All Causes this year.
This means there were 8 fewer deaths than expected from All Causes among pre-schoolers aged 1-4 living in Oregon in 2022.
Overall, 245 deaths from All Causes represent 85 lives saved among pre-schoolers aged 1-4 over the first 8 years of Oregon's New Normal™.
Click the bar graph above to see how the both the 2022 total of 8 fewer and the 8 year total of 245 fewer individual aged 1-4 deaths from All Causes is arrived at.
Yearly All Causes Tally: 212 / 44,590
The next 18 of the 44,590 individual deaths from All Causes in 2022 were among children aged 5-9, accounting for 99.94% of the 18 total deaths in this group.
This is up 7% compared to Old Normal rates. Those rates, applied to this year's population of 119,064 children aged 5-9, would have predicted 16 deaths from All Causes this year.
This means there were 2 more deaths than expected from All Causes among children aged 5-9 living in Oregon in 2022.
Overall, 141 deaths from All Causes represent 34 lives saved among children aged 5-9 over the first 8 years of Oregon's New Normal™.
Click the bar graph above to see how the both the 2022 total of 2 more and the 8 year total of 141 more individual aged 5-9 deaths from All Causes is arrived at.
Yearly All Causes Tally: 230 / 44,590
The next 37 of the 44,590 individual deaths from All Causes in 2022 were among children aged 10-14, accounting for 99.97% of the 37 total deaths in this group.
This is down 8% compared to Old Normal rates. Those rates, applied to this year's population of 246,508 children aged 10-14, would have predicted 38 deaths from All Causes this year.
This means there were 1 fewer deaths than expected from All Causes among children aged 10-14 living in Oregon in 2022.
Overall, 279 deaths from All Causes represent 5 lives saved among children aged 10-14 over the first 8 years of Oregon's New Normal™.
Click the bar graph above to see how the both the 2022 total of 1 fewer and the 8 year total of 279 fewer individual aged 10-14 deaths from All Causes is arrived at.
Yearly All Causes Tally: 267 / 44,590
The next 156 of the 44,590 individual deaths from All Causes in 2022 were among teens aged 15-19, accounting for 99.99% of the 156 total deaths in this group.
This is up 24% compared to Old Normal rates. Those rates, applied to this year's population of 250,767 teens aged 15-19, would have predicted 123 deaths from All Causes this year.
This means there were 33 more deaths than expected from All Causes among teens aged 15-19 living in Oregon in 2022.
Overall, 970 deaths from All Causes represent 1 lives lost among teens aged 15-19 over the first 8 years of Oregon's New Normal™.
Click the bar graph above to see how the both the 2022 total of 33 more and the 8 year total of 970 more individual aged 15-19 deaths from All Causes is arrived at.
Yearly All Causes Tally: 423 / 44,590
The next 242 of the 44,590 individual deaths from All Causes in 2022 were among people aged 20-24, accounting for 100.00% of the 242 total deaths in this group.
This is up 13% compared to Old Normal rates. Those rates, applied to this year's population of 272,409 people aged 20-24, would have predicted 212 deaths from All Causes this year.
This means there were 30 more deaths than expected from All Causes among people aged 20-24 living in Oregon in 2022.
Overall, 1,834 deaths from All Causes represent 178 lives lost among people aged 20-24 over the first 8 years of Oregon's New Normal™.
Click the bar graph above to see how the both the 2022 total of 30 more and the 8 year total of 1,834 more individual aged 20-24 deaths from All Causes is arrived at.
Yearly All Causes Tally: 665 / 44,590
The next 351 of the 44,590 individual deaths from All Causes in 2022 were among people aged 25-29, accounting for 100.00% of the 351 total deaths in this group.
This is up 54% compared to Old Normal rates. Those rates, applied to this year's population of 282,649 people aged 25-29, would have predicted 225 deaths from All Causes this year.
This means there were 126 more deaths than expected from All Causes among people aged 25-29 living in Oregon in 2022.
Overall, 2,342 deaths from All Causes represent 473 lives lost among people aged 25-29 over the first 8 years of Oregon's New Normal™.
Click the bar graph above to see how the both the 2022 total of 126 more and the 8 year total of 2,342 more individual aged 25-29 deaths from All Causes is arrived at.
Yearly All Causes Tally: 1,016 / 44,590
The next 541 of the 44,590 individual deaths from All Causes in 2022 were among people aged 30-34, accounting for 100.00% of the 541 total deaths in this group.
This is up 83% compared to Old Normal rates. Those rates, applied to this year's population of 309,969 people aged 30-34, would have predicted 293 deaths from All Causes this year.
This means there were 248 more deaths than expected from All Causes among people aged 30-34 living in Oregon in 2022.
Overall, 2,953 deaths from All Causes represent 706 lives lost among people aged 30-34 over the first 8 years of Oregon's New Normal™.
Click the bar graph above to see how the both the 2022 total of 248 more and the 8 year total of 2,953 more individual aged 30-34 deaths from All Causes is arrived at.
Yearly All Causes Tally: 1,557 / 44,590
The next 627 of the 44,590 individual deaths from All Causes in 2022 were among people aged 35-39, accounting for 100.00% of the 627 total deaths in this group.
This is up 56% compared to Old Normal rates. Those rates, applied to this year's population of 300,158 people aged 35-39, would have predicted 399 deaths from All Causes this year.
This means there were 228 more deaths than expected from All Causes among people aged 35-39 living in Oregon in 2022.
Overall, 3,649 deaths from All Causes represent 551 lives lost among people aged 35-39 over the first 8 years of Oregon's New Normal™.
Click the bar graph above to see how the both the 2022 total of 228 more and the 8 year total of 3,649 more individual aged 35-39 deaths from All Causes is arrived at.
Yearly All Causes Tally: 2,184 / 44,590
The next 742 of the 44,590 individual deaths from All Causes in 2022 were among people aged 40-44, accounting for 100.00% of the 742 total deaths in this group.
This is up 27% compared to Old Normal rates. Those rates, applied to this year's population of 291,313 people aged 40-44, would have predicted 583 deaths from All Causes this year.
This means there were 159 more deaths than expected from All Causes among people aged 40-44 living in Oregon in 2022.
Overall, 4,318 deaths from All Causes represent 12 lives saved among people aged 40-44 over the first 8 years of Oregon's New Normal™.
Click the bar graph above to see how the both the 2022 total of 159 more and the 8 year total of 4,318 more individual aged 40-44 deaths from All Causes is arrived at.
Yearly All Causes Tally: 2,926 / 44,590
The next 889 of the 44,590 individual deaths from All Causes in 2022 were among people aged 45-49, accounting for 100.00% of the 889 total deaths in this group.
This is up 9% compared to Old Normal rates. Those rates, applied to this year's population of 258,493 people aged 45-49, would have predicted 814 deaths from All Causes this year.
This means there were 75 more deaths than expected from All Causes among people aged 45-49 living in Oregon in 2022.
Overall, 6,233 deaths from All Causes represent 310 lives saved among people aged 45-49 over the first 8 years of Oregon's New Normal™.
Click the bar graph above to see how the both the 2022 total of 75 more and the 8 year total of 6,233 more individual aged 45-49 deaths from All Causes is arrived at.
Yearly All Causes Tally: 3,815 / 44,590
The next 1,331 of the 44,590 individual deaths from All Causes in 2022 were among people aged 50-54, accounting for 100.00% of the 1,331 total deaths in this group.
This is up 9% compared to Old Normal rates. Those rates, applied to this year's population of 260,908 people aged 50-54, would have predicted 1,218 deaths from All Causes this year.
This means there were 113 more deaths than expected from All Causes among people aged 50-54 living in Oregon in 2022.
Overall, 9,706 deaths from All Causes represent 174 lives lost among people aged 50-54 over the first 8 years of Oregon's New Normal™.
Click the bar graph above to see how the both the 2022 total of 113 more and the 8 year total of 9,706 more individual aged 50-54 deaths from All Causes is arrived at.
Yearly All Causes Tally: 5,146 / 44,590
The next 2,019 of the 44,590 individual deaths from All Causes in 2022 were among people aged 55-59, accounting for 100.00% of the 2,019 total deaths in this group.
This is up 21% compared to Old Normal rates. Those rates, applied to this year's population of 248,555 people aged 55-59, would have predicted 1,668 deaths from All Causes this year.
This means there were 351 more deaths than expected from All Causes among people aged 55-59 living in Oregon in 2022.
Overall, 15,671 deaths from All Causes represent 1,411 lives lost among people aged 55-59 over the first 8 years of Oregon's New Normal™.
Click the bar graph above to see how the both the 2022 total of 351 more and the 8 year total of 15,671 more individual aged 55-59 deaths from All Causes is arrived at.
Yearly All Causes Tally: 7,165 / 44,590
The next 3,118 of the 44,590 individual deaths from All Causes in 2022 were among people aged 60-64, accounting for 100.00% of the 3,118 total deaths in this group.
This is up 17% compared to Old Normal rates. Those rates, applied to this year's population of 264,615 people aged 60-64, would have predicted 2,673 deaths from All Causes this year.
This means there were 445 more deaths than expected from All Causes among people aged 60-64 living in Oregon in 2022.
Overall, 22,684 deaths from All Causes represent 732 lives lost among people aged 60-64 over the first 8 years of Oregon's New Normal™.
Click the bar graph above to see how the both the 2022 total of 445 more and the 8 year total of 22,684 more individual aged 60-64 deaths from All Causes is arrived at.
Yearly All Causes Tally: 10,283 / 44,590
The next 4,199 of the 44,590 individual deaths from All Causes in 2022 were among elderly men and women aged 65-69, accounting for 100.00% of the 4,199 total deaths in this group.
This is up 6% compared to Old Normal rates. Those rates, applied to this year's population of 260,496 elderly men and women aged 65-69, would have predicted 3,964 deaths from All Causes this year.
This means there were 235 more deaths than expected from All Causes among elderly men and women aged 65-69 living in Oregon in 2022.
Overall, 29,296 deaths from All Causes represent 1,527 lives saved among elderly men and women aged 65-69 over the first 8 years of Oregon's New Normal™.
Click the bar graph above to see how the both the 2022 total of 235 more and the 8 year total of 29,296 more individual aged 65-69 deaths from All Causes is arrived at.
Yearly All Causes Tally: 14,482 / 44,590
The next 5,134 of the 44,590 individual deaths from All Causes in 2022 were among elderly men and women aged 70-74, accounting for 100.00% of the 5,134 total deaths in this group.
This is down 7% compared to Old Normal rates. Those rates, applied to this year's population of 225,473 elderly men and women aged 70-74, would have predicted 5,495 deaths from All Causes this year.
This means there were 361 fewer deaths than expected from All Causes among elderly men and women aged 70-74 living in Oregon in 2022.
Overall, 33,798 deaths from All Causes represent 4,811 lives saved among elderly men and women aged 70-74 over the first 8 years of Oregon's New Normal™.
Click the bar graph above to see how the both the 2022 total of 361 fewer and the 8 year total of 33,798 fewer individual aged 70-74 deaths from All Causes is arrived at.
Yearly All Causes Tally: 19,616 / 44,590
The next 5,963 of the 44,590 individual deaths from All Causes in 2022 were among elderly men and women aged 75-79, accounting for 100.00% of the 5,963 total deaths in this group.
This is down 4% compared to Old Normal rates. Those rates, applied to this year's population of 157,501 elderly men and women aged 75-79, would have predicted 6,203 deaths from All Causes this year.
This means there were 240 fewer deaths than expected from All Causes among elderly men and women aged 75-79 living in Oregon in 2022.
Overall, 37,066 deaths from All Causes represent 3,960 lives saved among elderly men and women aged 75-79 over the first 8 years of Oregon's New Normal™.
Click the bar graph above to see how the both the 2022 total of 240 fewer and the 8 year total of 37,066 fewer individual aged 75-79 deaths from All Causes is arrived at.
Yearly All Causes Tally: 25,579 / 44,590
The next 5,753 of the 44,590 individual deaths from All Causes in 2022 were among elderly men and women aged 80-84, accounting for 100.00% of the 5,753 total deaths in this group.
This is down 1% compared to Old Normal rates. Those rates, applied to this year's population of 89,771 elderly men and women aged 80-84, would have predicted 5,808 deaths from All Causes this year.
This means there were 55 fewer deaths than expected from All Causes among elderly men and women aged 80-84 living in Oregon in 2022.
Overall, 39,289 deaths from All Causes represent 2,300 lives saved among elderly men and women aged 80-84 over the first 8 years of Oregon's New Normal™.
Click the bar graph above to see how the both the 2022 total of 55 fewer and the 8 year total of 39,289 fewer individual aged 80-84 deaths from All Causes is arrived at.
Yearly All Causes Tally: 31,332 / 44,590
The next 19,011 of the 44,590 deaths from All Causes in 2022 were among elderly men and women aged 80+, accounting for 100.00% of the 19,011 total deaths in this group.
This is up 3% compared to Old Normal rates which, when applied to this year's population of 89,771 would have predicted 18,476 deaths from All Causes this year.
This means there were 535 more deaths than expected from All Causes among elderly men and women aged 80+ living in Oregon in 2022.
Overall, 138,667 deaths from All Causes represent 6,360 lives lost among elderly men and women aged 80+ over the first 8 years of Oregon's New Normal™.
Click the bar graph above to see how the 8 year total of 138,667 excess individual deaths from All Causes is arrived at.
Yearly All Causes Tally: 50,343 / 44,590*
* Oregon does not report the deaths of 5,753 babies in it's death totals