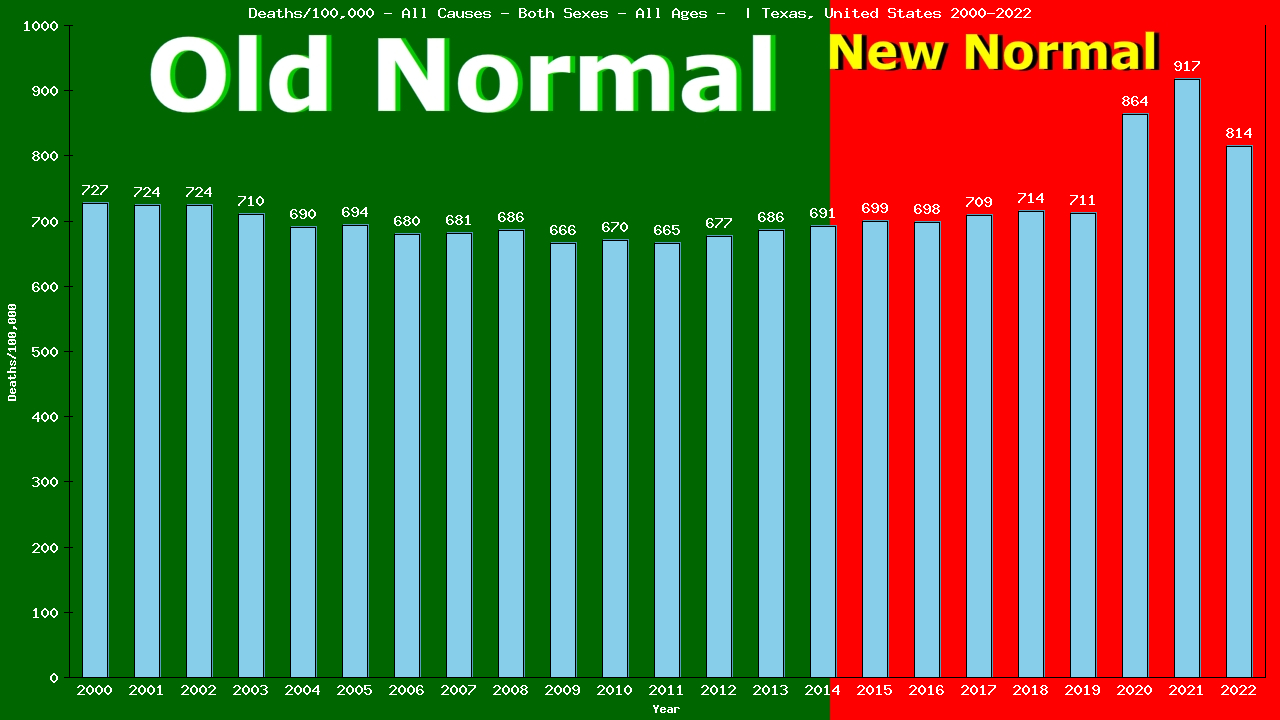
2022 vs New Normal™ for individuals of all ages in Texas
241,433 of 241,433 total deaths were from All Causes
100.00% of all deaths were from All Causes
This is up 18% compared to Old Normal rates.
204,605 of 204,605 total deaths would have been expected under Old Normal conditions.
36,828 more deaths from All Causes in 2022.
176,374 more deaths from All Causes (2015-2022)
To show this year’s deaths from All Causes are up 18% compared to Old Normal rates, we need to calculate the rates for both 2022 and for the Old Normal.
Remember, death rates are calculated to answer these questions:
“How many individuals of all ages were there?” and
“How many of them died from All Causes?”
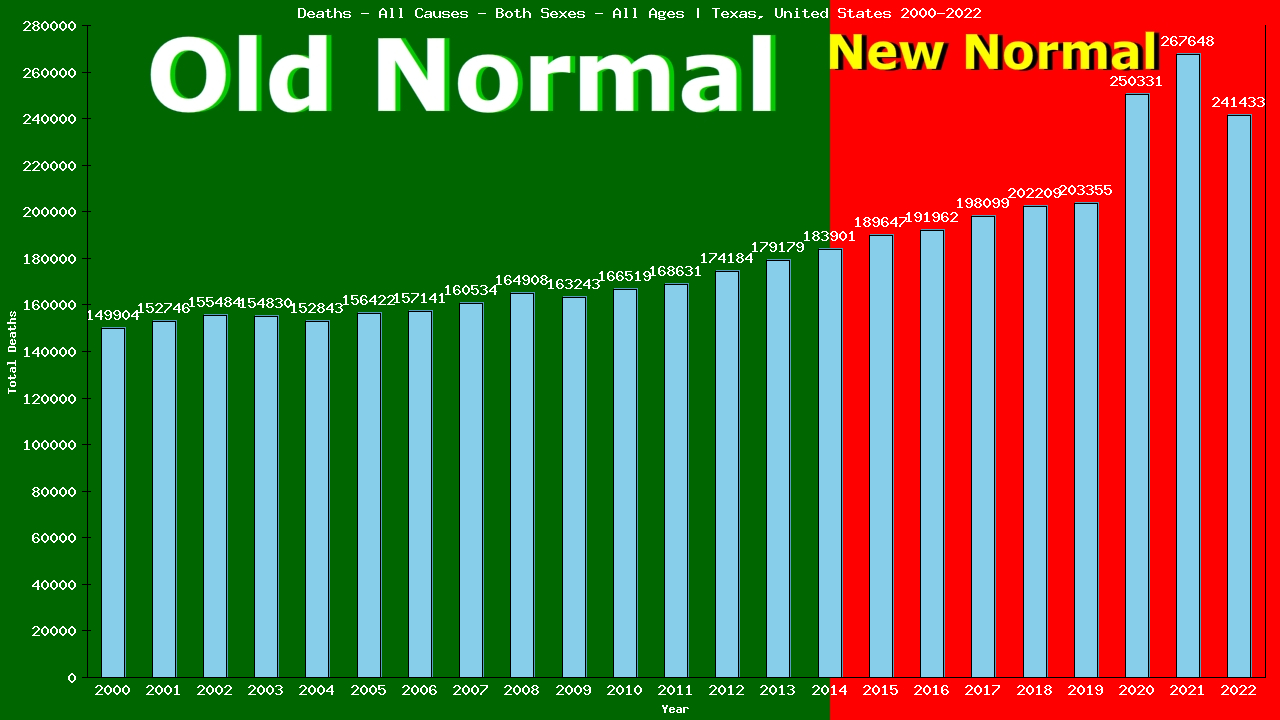
The following 2 charts provide this information:
Deaths – All Causes – Both Sexes – Of All Ages | Texas, United-states
Populalation – Both Sexes – Of All Ages – [2000-2022] | Texas, United-states
From the charts, we can see that in 2022, 241,433 of 29,627,942 individuals of all ages living in Texas died from All Causes.
241,433 ÷ 29,627,942 = 0.00815 (2022 CDR)
We’ll use the table below to calculate our Old Normal rate for deaths from All Causes
Old Normal (2001-2014) Texas both sexes of all ages All Causes
Year
Pop
Died
From
|2000
20,613,880
149,904
149,904
|2001
21,081,209
152,746
152,746
|2002
21,451,787
155,484
155,484
|2003
21,788,312
154,830
154,830
|2004
22,147,947
152,843
152,843
|Year
Pop
Died
From
|2005
22,522,243
156,422
156,422
|2006
23,093,112
157,141
157,141
|2007
23,555,577
160,534
160,534
|2008
24,023,328
164,908
164,908
|2009
24,504,994
163,243
163,243
|Year
Pop
Died
From
|2010
24,840,382
166,519
166,519
|2011
25,351,877
168,631
168,631
|2012
25,723,571
174,184
174,184
|2013
26,100,301
179,179
179,179
|2014
26,595,456
183,901
183,901
Cumulative:
Population
Deaths
All Causes
Totals:
353,393,976
2,440,469
2,440,469
The table shows there were a total of 2,440,469 deaths from All Causes among 353,393,976 individuals of all ages living in Texas in the 15 years immediately prior to the New Normal™.
2,440,469 ÷ 353,393,976 = 0.00691 (Old Normal CDR)
We can use the Old Normal rate to predict this year’s deaths:
2022 pop X Old Normal CDR = expected deaths
29,627,942 X 0.00691 = 204,605 expected deaths
The difference between actual and expected deaths shows lives saved or lost:
241,433 – 204,605 = 36,828
Dividing the actual deaths by the expected deaths gives us the comparative rates:
241,433 ÷ 204,605 = 1.1783
This reveals 36,828 lives lost and is 117.83% of what we expected (an increase of 18%) in deaths from All Causes among individuals of all ages living in Texas in 2022, as compared to the Old Normal.
Compare our Old Normal to the 5yr CDR. Does it tell the same story your TV does?
5yr CDR (2017-2021)
Year
Pop
Died
From
|2017
27,909,205
198,099
198,099
|2018
28,301,346
202,209
202,209
|2019
28,587,422
203,355
203,355
|2020
28,946,829
250,331
250,331
|2021
29,158,032
267,648
267,648
Total:
197,472,315
1,503,251
1,503,251
This is the same method used by Public Health to calculate the 5-yr CDR (Cumulative Death Rate):
1,503,251 ÷ 197,472,315 = 0.00761 (5-yr CDR)
29,627,942(2022 pop) X 0.00761 = 225,542 expected deaths
The difference between actual and expected deaths:
241,433 – 225,542 = 15,891 or 15,891 lives lost
Divide actual deaths by expected deaths:
241,433 ÷ 225,542 = 1.0691 or an increase of 7%
for deaths from All Causes among individuals of all ages living in Texas in 2022, as compared to the previous 5 years.
Finally, the same method can also be used to compare our Old Normal rate to the New Normal™ rate:
New Normal™ population X Old Normal rate = expected deaths
227,100,257 X 0.00691 = 1,568,310 expected deaths
The difference between actual and expected deaths:
1744684 – 1,568,310 = 176,374 or 176,374 lives lost
Dividing the actual deaths by the expected deaths:
1,744,684 ÷ 1,568,310 = 1.1109 or an increase of 11%
in deaths from All Causes among individuals of all ages living in Texas in the New Normal™, as compared to the Old Normal.
New Normal (2015-2022)
Year
Pop
Died
From
|2015
27,094,675
189,647
189,647
|2016
27,474,806
191,962
191,962
|2017
27,909,205
198,099
198,099
|2018
28,301,346
202,209
202,209
|2019
28,587,422
203,355
203,355
|2020
28,946,829
250,331
250,331
|2021
29,158,032
267,648
267,648
|2022
29,627,942
241,433
241,433
Total:
227,100,257
1,744,684
1,744,684
The world has been led to believe that a deadly pandemic swept the globe beginning in 2020, causing an increase in death rates, especially among the elderly
The data show that death rates began to increase in 2015, immediately upon implementation of the UN’s 2030 Agenda for Sustainable Development, that young adults have experienced ever-increasing death rates since, and that death rates among the elderly have remained relatively stable.
Browse through the age-categorized charts below to see the evidence of this. Click on any chart to see the full analysis for each age group.
241,433 of the 241,433 deaths among individuals of all ages living in Texas in 2022 were from All Causes (100.00% of all deaths).
This is up 18% compared to Old Normal (2000-2014) rates which, when applied to the this year's both sexes population of 29,627,942 individuals would have predicted 204,605 deaths from All Causes.
This means there were 36,828 more deaths than expected from All Causes among individuals of all ages living in Texas in 2022.
To date, 176,374 individual lives have been lost to All Causes over the first 8 years of Texas's New Normal™.
Browse through the age categories below to learn how these deaths from All Causes in 2022 are distributed among each age group of individuals in Texas.
Click the bar graph above to see how both the 2022 loss of 36,828 lives and the 8-year loss of 176,374 individual lives from All Causes is arrived at.
The first 2,243 of the 241,433 deaths from All Causes in 2022 were among babies in their first year of life, accounting for 100.00% of the 2,243 total deaths in this group.
This is down 6% compared to Old Normal rates which, when applied to this year's population of 378,682 babies in their first year of life, would have predicted 2,375 deaths from All Causes this year.
This means there were 132 fewer deaths than expected from All Causes among babies in their first year of life living in Texas in 2022.
Overall, 17,186 deaths from All Causes represent 2,215 lives saved among babies in their first year of life over the first 8 years of Texas's New Normal™.
Click the bar graph above to see how both the 2022 total of 132 fewer live lost than expected and the 8 year total of 17186 lives saved from All Causes among babies in their first year of life is arrived at.
Yearly All Causes Tally: 2,243 / 241,433
The next 459 of the 241,433 individual deaths from All Causes in 2022 were among pre-schoolers aged 1-4, accounting for 100.00% of the 459 total deaths in this group.
This is down 8% compared to Old Normal rates. Those rates, applied to this year's population of 1,523,957 pre-schoolers aged 1-4, would have predicted 484 deaths from All Causes this year.
This means there were 25 fewer deaths than expected from All Causes among pre-schoolers aged 1-4 living in Texas in 2022.
Overall, 3,410 deaths from All Causes represent 637 lives saved among pre-schoolers aged 1-4 over the first 8 years of Texas's New Normal™.
Click the bar graph above to see how the both the 2022 total of 25 fewer and the 8 year total of 3,410 fewer individual aged 1-4 deaths from All Causes is arrived at.
Yearly All Causes Tally: 2,702 / 241,433
The next 264 of the 241,433 individual deaths from All Causes in 2022 were among children aged 5-9, accounting for 100.00% of the 264 total deaths in this group.
This is down 17% compared to Old Normal rates. Those rates, applied to this year's population of 2,085,857 children aged 5-9, would have predicted 296 deaths from All Causes this year.
This means there were 32 fewer deaths than expected from All Causes among children aged 5-9 living in Texas in 2022.
Overall, 1,987 deaths from All Causes represent 350 lives saved among children aged 5-9 over the first 8 years of Texas's New Normal™.
Click the bar graph above to see how the both the 2022 total of 32 fewer and the 8 year total of 1,987 fewer individual aged 5-9 deaths from All Causes is arrived at.
Yearly All Causes Tally: 2,966 / 241,433
The next 389 of the 241,433 individual deaths from All Causes in 2022 were among children aged 10-14, accounting for 100.00% of the 389 total deaths in this group.
This is up 1% compared to Old Normal rates. Those rates, applied to this year's population of 2,150,307 children aged 10-14, would have predicted 372 deaths from All Causes this year.
This means there were 17 more deaths than expected from All Causes among children aged 10-14 living in Texas in 2022.
Overall, 2,694 deaths from All Causes represent 207 lives saved among children aged 10-14 over the first 8 years of Texas's New Normal™.
Click the bar graph above to see how the both the 2022 total of 17 more and the 8 year total of 2,694 more individual aged 10-14 deaths from All Causes is arrived at.
Yearly All Causes Tally: 3,355 / 241,433
The next 1,413 of the 241,433 individual deaths from All Causes in 2022 were among teens aged 15-19, accounting for 100.00% of the 1,413 total deaths in this group.
This is up 8% compared to Old Normal rates. Those rates, applied to this year's population of 2,152,692 teens aged 15-19, would have predicted 1,281 deaths from All Causes this year.
This means there were 132 more deaths than expected from All Causes among teens aged 15-19 living in Texas in 2022.
Overall, 9,130 deaths from All Causes represent 597 lives saved among teens aged 15-19 over the first 8 years of Texas's New Normal™.
Click the bar graph above to see how the both the 2022 total of 132 more and the 8 year total of 9,130 more individual aged 15-19 deaths from All Causes is arrived at.
Yearly All Causes Tally: 4,768 / 241,433
The next 2,187 of the 241,433 individual deaths from All Causes in 2022 were among people aged 20-24, accounting for 100.00% of the 2,187 total deaths in this group.
This is up 6% compared to Old Normal rates. Those rates, applied to this year's population of 2,191,176 people aged 20-24, would have predicted 2,042 deaths from All Causes this year.
This means there were 145 more deaths than expected from All Causes among people aged 20-24 living in Texas in 2022.
Overall, 15,544 deaths from All Causes represent 380 lives lost among people aged 20-24 over the first 8 years of Texas's New Normal™.
Click the bar graph above to see how the both the 2022 total of 145 more and the 8 year total of 15,544 more individual aged 20-24 deaths from All Causes is arrived at.
Yearly All Causes Tally: 6,955 / 241,433
The next 2,733 of the 241,433 individual deaths from All Causes in 2022 were among people aged 25-29, accounting for 100.00% of the 2,733 total deaths in this group.
This is up 31% compared to Old Normal rates. Those rates, applied to this year's population of 2,133,941 people aged 25-29, would have predicted 2,067 deaths from All Causes this year.
This means there were 666 more deaths than expected from All Causes among people aged 25-29 living in Texas in 2022.
Overall, 18,672 deaths from All Causes represent 2,252 lives lost among people aged 25-29 over the first 8 years of Texas's New Normal™.
Click the bar graph above to see how the both the 2022 total of 666 more and the 8 year total of 18,672 more individual aged 25-29 deaths from All Causes is arrived at.
Yearly All Causes Tally: 9,688 / 241,433
The next 3,370 of the 241,433 individual deaths from All Causes in 2022 were among people aged 30-34, accounting for 100.00% of the 3,370 total deaths in this group.
This is up 38% compared to Old Normal rates. Those rates, applied to this year's population of 2,203,467 people aged 30-34, would have predicted 2,425 deaths from All Causes this year.
This means there were 945 more deaths than expected from All Causes among people aged 30-34 living in Texas in 2022.
Overall, 22,537 deaths from All Causes represent 4,117 lives lost among people aged 30-34 over the first 8 years of Texas's New Normal™.
Click the bar graph above to see how the both the 2022 total of 945 more and the 8 year total of 22,537 more individual aged 30-34 deaths from All Causes is arrived at.
Yearly All Causes Tally: 13,058 / 241,433
The next 4,212 of the 241,433 individual deaths from All Causes in 2022 were among people aged 35-39, accounting for 100.00% of the 4,212 total deaths in this group.
This is up 33% compared to Old Normal rates. Those rates, applied to this year's population of 2,151,212 people aged 35-39, would have predicted 3,144 deaths from All Causes this year.
This means there were 1,068 more deaths than expected from All Causes among people aged 35-39 living in Texas in 2022.
Overall, 27,763 deaths from All Causes represent 4,061 lives lost among people aged 35-39 over the first 8 years of Texas's New Normal™.
Click the bar graph above to see how the both the 2022 total of 1,068 more and the 8 year total of 27,763 more individual aged 35-39 deaths from All Causes is arrived at.
Yearly All Causes Tally: 17,270 / 241,433
The next 5,168 of the 241,433 individual deaths from All Causes in 2022 were among people aged 40-44, accounting for 100.00% of the 5,168 total deaths in this group.
This is up 13% compared to Old Normal rates. Those rates, applied to this year's population of 2,052,394 people aged 40-44, would have predicted 4,551 deaths from All Causes this year.
This means there were 617 more deaths than expected from All Causes among people aged 40-44 living in Texas in 2022.
Overall, 34,278 deaths from All Causes represent 633 lives lost among people aged 40-44 over the first 8 years of Texas's New Normal™.
Click the bar graph above to see how the both the 2022 total of 617 more and the 8 year total of 34,278 more individual aged 40-44 deaths from All Causes is arrived at.
Yearly All Causes Tally: 22,438 / 241,433
The next 6,347 of the 241,433 individual deaths from All Causes in 2022 were among people aged 45-49, accounting for 100.00% of the 6,347 total deaths in this group.
This is up 0% compared to Old Normal rates. Those rates, applied to this year's population of 1,856,501 people aged 45-49, would have predicted 6,346 deaths from All Causes this year.
This means there were 1 more deaths than expected from All Causes among people aged 45-49 living in Texas in 2022.
Overall, 48,716 deaths from All Causes represent 1,171 lives saved among people aged 45-49 over the first 8 years of Texas's New Normal™.
Click the bar graph above to see how the both the 2022 total of 1 more and the 8 year total of 48,716 more individual aged 45-49 deaths from All Causes is arrived at.
Yearly All Causes Tally: 28,785 / 241,433
The next 9,214 of the 241,433 individual deaths from All Causes in 2022 were among people aged 50-54, accounting for 100.00% of the 9,214 total deaths in this group.
This is down 2% compared to Old Normal rates. Those rates, applied to this year's population of 1,820,166 people aged 50-54, would have predicted 9,416 deaths from All Causes this year.
This means there were 202 fewer deaths than expected from All Causes among people aged 50-54 living in Texas in 2022.
Overall, 72,219 deaths from All Causes represent 2 lives saved among people aged 50-54 over the first 8 years of Texas's New Normal™.
Click the bar graph above to see how the both the 2022 total of 202 fewer and the 8 year total of 72,219 fewer individual aged 50-54 deaths from All Causes is arrived at.
Yearly All Causes Tally: 37,999 / 241,433
The next 13,543 of the 241,433 individual deaths from All Causes in 2022 were among people aged 55-59, accounting for 100.00% of the 13,543 total deaths in this group.
This is up 5% compared to Old Normal rates. Those rates, applied to this year's population of 1,684,359 people aged 55-59, would have predicted 12,903 deaths from All Causes this year.
This means there were 640 more deaths than expected from All Causes among people aged 55-59 living in Texas in 2022.
Overall, 108,975 deaths from All Causes represent 4,907 lives lost among people aged 55-59 over the first 8 years of Texas's New Normal™.
Click the bar graph above to see how the both the 2022 total of 640 more and the 8 year total of 108,975 more individual aged 55-59 deaths from All Causes is arrived at.
Yearly All Causes Tally: 51,542 / 241,433
The next 19,611 of the 241,433 individual deaths from All Causes in 2022 were among people aged 60-64, accounting for 100.00% of the 19,611 total deaths in this group.
This is up 7% compared to Old Normal rates. Those rates, applied to this year's population of 1,617,808 people aged 60-64, would have predicted 18,341 deaths from All Causes this year.
This means there were 1,270 more deaths than expected from All Causes among people aged 60-64 living in Texas in 2022.
Overall, 146,232 deaths from All Causes represent 7,944 lives lost among people aged 60-64 over the first 8 years of Texas's New Normal™.
Click the bar graph above to see how the both the 2022 total of 1,270 more and the 8 year total of 146,232 more individual aged 60-64 deaths from All Causes is arrived at.
Yearly All Causes Tally: 71,153 / 241,433
The next 23,809 of the 241,433 individual deaths from All Causes in 2022 were among elderly men and women aged 65-69, accounting for 100.00% of the 23,809 total deaths in this group.
This is up 4% compared to Old Normal rates. Those rates, applied to this year's population of 1,369,271 elderly men and women aged 65-69, would have predicted 22,894 deaths from All Causes this year.
This means there were 915 more deaths than expected from All Causes among elderly men and women aged 65-69 living in Texas in 2022.
Overall, 169,098 deaths from All Causes represent 1,615 lives lost among elderly men and women aged 65-69 over the first 8 years of Texas's New Normal™.
Click the bar graph above to see how the both the 2022 total of 915 more and the 8 year total of 169,098 more individual aged 65-69 deaths from All Causes is arrived at.
Yearly All Causes Tally: 94,962 / 241,433
The next 27,542 of the 241,433 individual deaths from All Causes in 2022 were among elderly men and women aged 70-74, accounting for 100.00% of the 27,542 total deaths in this group.
This is down 1% compared to Old Normal rates. Those rates, applied to this year's population of 1,069,219 elderly men and women aged 70-74, would have predicted 27,727 deaths from All Causes this year.
This means there were 185 fewer deaths than expected from All Causes among elderly men and women aged 70-74 living in Texas in 2022.
Overall, 190,005 deaths from All Causes represent 7,138 lives saved among elderly men and women aged 70-74 over the first 8 years of Texas's New Normal™.
Click the bar graph above to see how the both the 2022 total of 185 fewer and the 8 year total of 190,005 fewer individual aged 70-74 deaths from All Causes is arrived at.
Yearly All Causes Tally: 122,504 / 241,433
The next 29,642 of the 241,433 individual deaths from All Causes in 2022 were among elderly men and women aged 75-79, accounting for 100.00% of the 29,642 total deaths in this group.
This is down 5% compared to Old Normal rates. Those rates, applied to this year's population of 745,616 elderly men and women aged 75-79, would have predicted 31,099 deaths from All Causes this year.
This means there were 1,457 fewer deaths than expected from All Causes among elderly men and women aged 75-79 living in Texas in 2022.
Overall, 199,588 deaths from All Causes represent 13,222 lives saved among elderly men and women aged 75-79 over the first 8 years of Texas's New Normal™.
Click the bar graph above to see how the both the 2022 total of 1,457 fewer and the 8 year total of 199,588 fewer individual aged 75-79 deaths from All Causes is arrived at.
Yearly All Causes Tally: 152,146 / 241,433
The next 29,552 of the 241,433 individual deaths from All Causes in 2022 were among elderly men and women aged 80-84, accounting for 100.00% of the 29,552 total deaths in this group.
This is down 1% compared to Old Normal rates. Those rates, applied to this year's population of 441,317 elderly men and women aged 80-84, would have predicted 29,848 deaths from All Causes this year.
This means there were 296 fewer deaths than expected from All Causes among elderly men and women aged 80-84 living in Texas in 2022.
Overall, 211,230 deaths from All Causes represent 11,320 lives saved among elderly men and women aged 80-84 over the first 8 years of Texas's New Normal™.
Click the bar graph above to see how the both the 2022 total of 296 fewer and the 8 year total of 211,230 fewer individual aged 80-84 deaths from All Causes is arrived at.
Yearly All Causes Tally: 181,698 / 241,433
The next 89,287 of the 241,433 deaths from All Causes in 2022 were among elderly men and women aged 80+, accounting for 100.00% of the 89,287 total deaths in this group.
This is up 4% compared to Old Normal rates which, when applied to this year's population of 441,317 would have predicted 85,770 deaths from All Causes this year.
This means there were 3,517 more deaths than expected from All Causes among elderly men and women aged 80+ living in Texas in 2022.
Overall, 656,650 deaths from All Causes represent 17,137 lives lost among elderly men and women aged 80+ over the first 8 years of Texas's New Normal™.
Click the bar graph above to see how the 8 year total of 656,650 excess individual deaths from All Causes is arrived at.
Yearly All Causes Tally: 270,985 / 241,433*
* Texas does not report the deaths of 29,552 babies in it's death totals