Excess Deaths
Excess Deaths
in
2023

- Categories:
- Other ill-defined and unspecified causes of mortality (324)

- Unspecified fall (212)
- Exposure to unspecified factor (103)
- Other specified general symptoms and signs (28)
- Cachexia (8)
- Malaise and fatigue (4)
- Shock, unspecified (4)
- Other and unspecified convulsions (3)
- Chest pain, unspecified (1)
- Other chronic pain (1)
- Pulseless electrical activity, not elsewhere classified (1)
- Deaths: Government of Canada
- Population: Government of Canada
Quick Links
- There were a total of 326,215 deaths in Canada in 2023
- 156,651 of all deaths were among females
- 45,094 of all deaths were among those aged 80-84
- 21,182 of all deaths were among elderly women aged 80-84
- 17,453 of all deaths were from Unknown Causes
- 7,247 of female deaths were from Unknown Causes
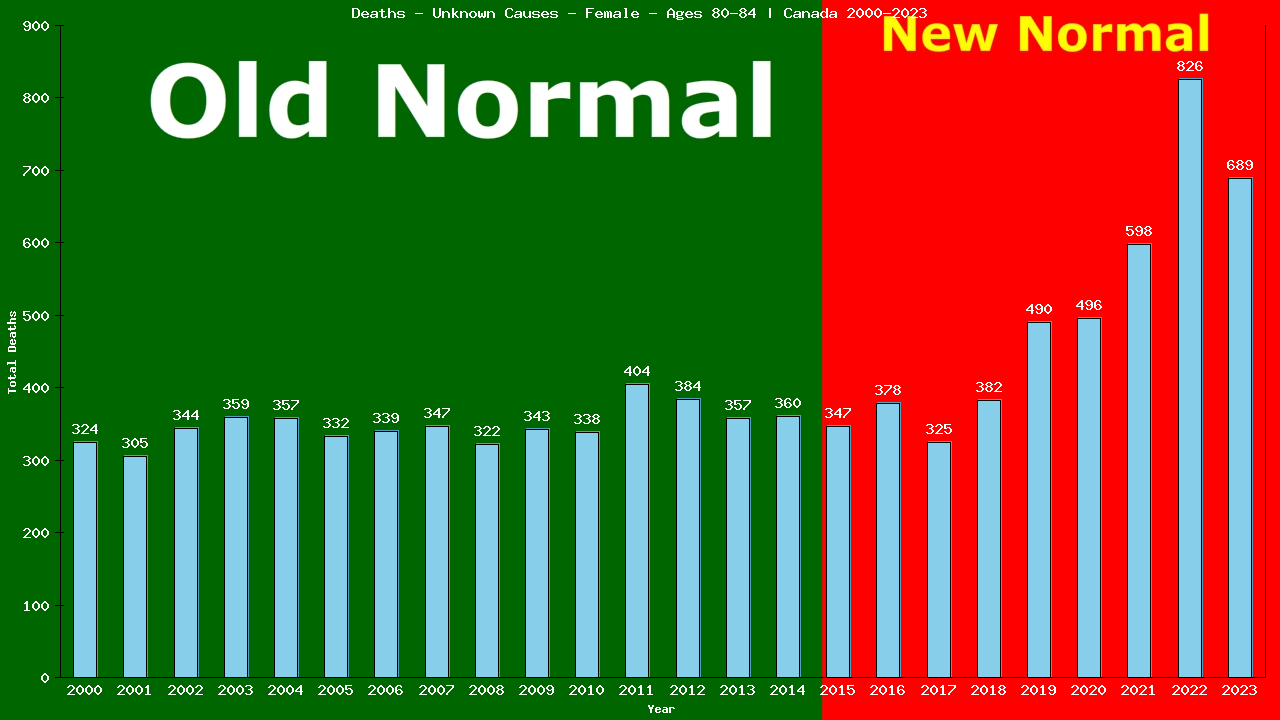
- 689 deaths from Unknown Causes were among those aged 80-84
689 deaths from Unknown Causes were among elderly women aged 80-84

2023 vs New Normal™ for elderly women aged 80-84 in Canada
- 689 of 21,182 total deaths were from Unknown Causes
- 3.25% of all deaths were from Unknown Causes
- This is up 48% compared to Old Normal rates.
- 461 of 24,826 total deaths would have been expected under Old Normal conditions.
- 228 excess deaths from Unknown Causes in 2023.
- 3,644 fewer than expected All Cause deaths in 2023.
- 863 excess deaths from Unknown Causes (2015-2023)
- 24,859 fewer than expected All Cause deaths over the first 9 years of Canada’s New Normal™.
- To show this year’s deaths from Unknown Causes are up 48% compared to Old Normal rates, we need to calculate the rates for both 2023 and for the Old Normal.
Remember, death rates are calculated to answer these questions:
- “How many elderly women aged 80-84 were there?” and
- “How many of them died from Unknown Causes?”
The following 2 charts provide this information:
Deaths – Unknown Causes – Female – Aged 80-84 | Canada, Canada

Population – Female – Aged 80-84 – [2000-2023] | Canada, Canada
![Graph showing Population - Female - Aged 80-84 - [2000-2023] | Canada, Canada](/wp-content/plugins/dfuc-display/charts/canada/canada/2023/all/Female/80-84-pop.png)
From the charts, we can see that in 2023, 689 of 508,127 elderly women aged 80-84 living in Canada died from Unknown Causes.
689 ÷ 508,127 = 0.00136 (2023 CDR)
Deaths/100,000 Female 80-84 from Unknown Causes

The table shows there were a total of 5,215 deaths from Unknown Causes among 5,752,063 elderly women aged 80-84 living in Canada in the 15 years immediately prior to the New Normal™.
5,215 ÷ 5,752,063 = 0.00091 (Old Normal CDR)
We can use the Old Normal rate to predict this year’s deaths:
2023 pop X Old Normal CDR = expected deaths
508,127 X 0.00091 = 461 expected deaths
The difference between actual and expected deaths shows lives saved or lost:
689 – 461 = 228
Dividing the actual deaths by the expected deaths gives us the comparative rates:
689 ÷ 461 = 1.4793
This reveals 228 lives lost and is 147.93% of what we expected (an increase of 48%) in deaths from Unknown Causes among elderly women aged 80-84 living in Canada in 2023, as compared to the Old Normal.
This is the same method used by Public Health to calculate the 5-yr CDR (Cumulative Death Rate):
3,842 ÷ 3,537,092 = 0.00109 (5-yr CDR)
508,127(2023 pop) X 0.00109 = 552 expected deaths
The difference between actual and expected deaths:
689 – 552 = 137 or 137 lives lost
Divide actual deaths by expected deaths:
689 ÷ 552 = 1.2370 or an increase of 24%
for deaths from Unknown Causes among elderly women aged 80-84 living in Canada in 2023, as compared to the previous 5 years.
Compare our Old Normal to the 5yr CDR. Does it tell the same story your TV does?
Finally, the same method can also be used to compare our Old Normal rate to the New Normal™ rate:
New Normal™ population X Old Normal rate = expected deaths
4,045,219 X 0.00091 = 3,668 expected deaths
The difference between actual and expected deaths:
4531 – 3,668 = 863 or 863 lives lost
Dividing the actual deaths by the expected deaths:
4,531 ÷ 3,668 = 1.2220 or an increase of 22%
in deaths from Unknown Causes among elderly women aged 80-84 living in Canada in the New Normal™, as compared to the Old Normal.
Ursula von der Leyen and her globalist buddies came up with UN “Sustainable” Development Goal SDG3 – “Ensure healthy lives and promote well-being for all at all ages” and began implementing it in 2015.
Browse through the tabs for all ages below to see the results of 9 years of their New Normal™
Is this health and well being?
Is this “sustainable”?
Can we allow this to continue?
The world has been led to believe that a deadly pandemic swept the globe beginning in 2020, causing an increase in death rates, especially among the elderly
The data show that death rates began to increase in 2015, immediately upon implementation of the UN’s 2030 Agenda for Sustainable Development, that young adults have experienced ever-increasing death rates since, and that death rates among the elderly have remained relatively stable.
Return to the top of the page to select another age category.


×