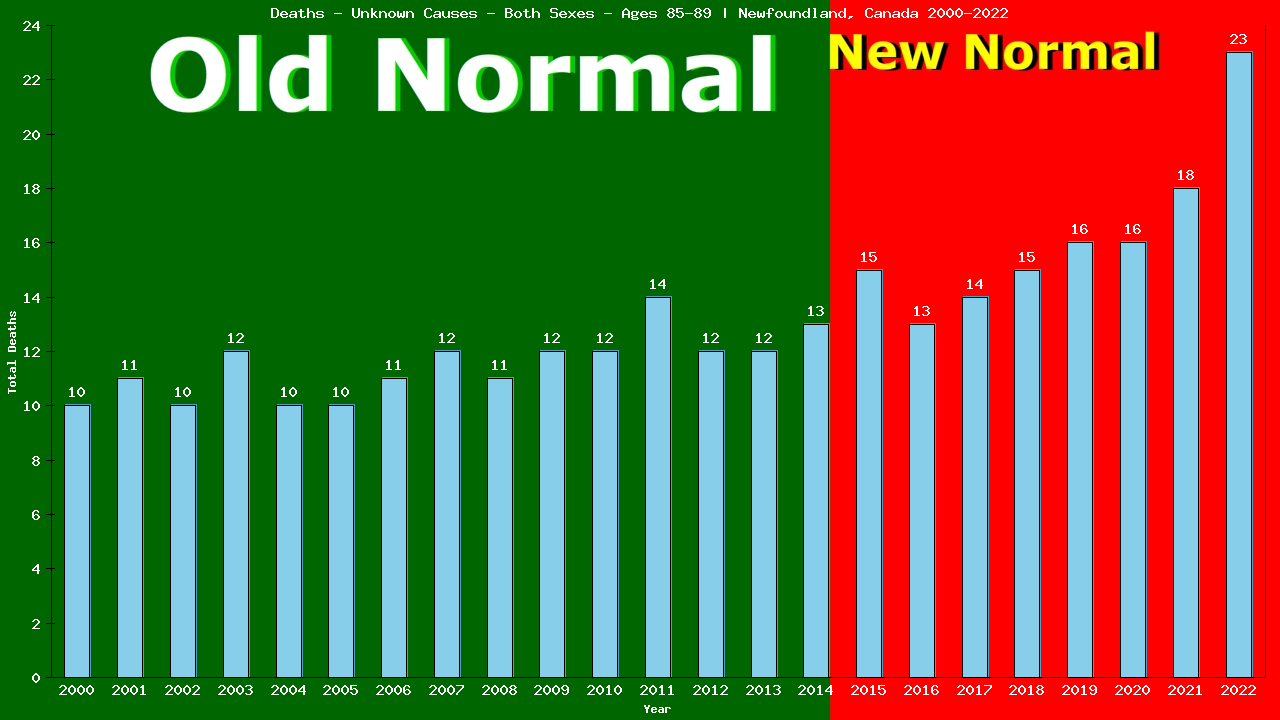
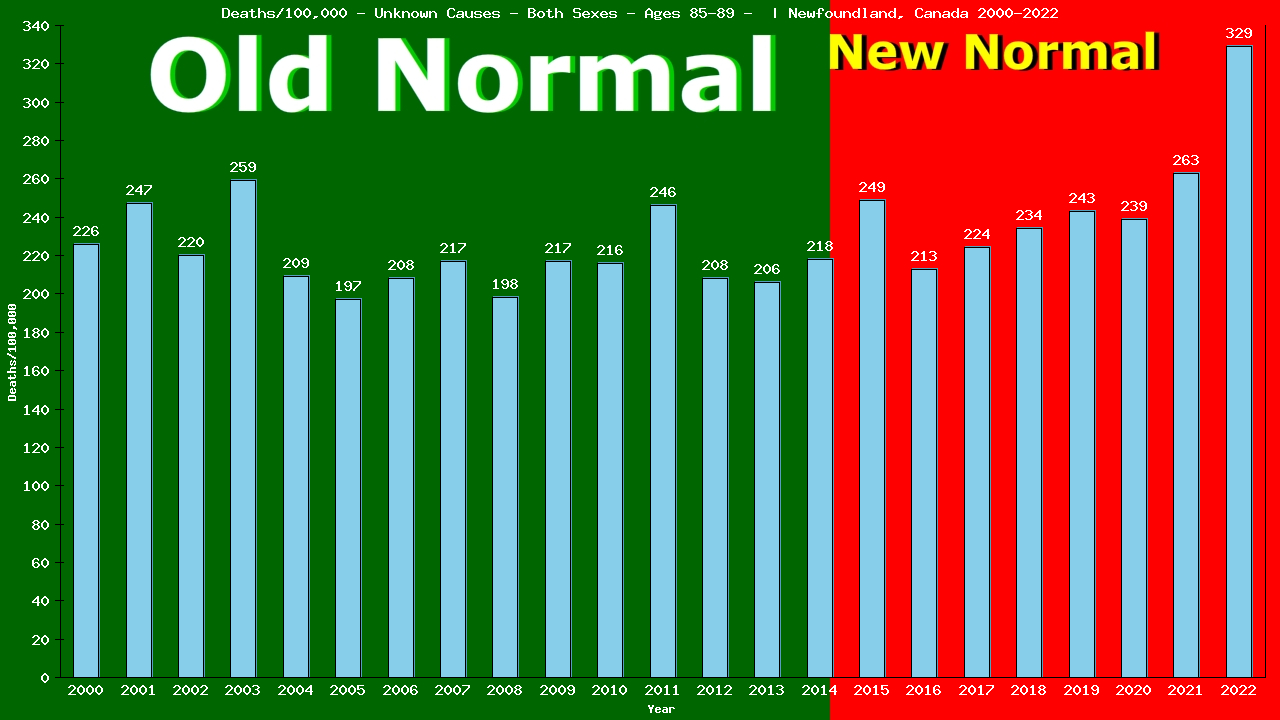
2022 vs New Normal™ for elderly men and women aged 85-89 in Newfoundland
39 of 957 total deaths were from Unknown Causes
100.00% of all deaths were from Unknown Causes
This is up 111% compared to Old Normal rates.
18 of 849 total deaths would have been expected under Old Normal conditions.
21 more deaths from Unknown Causes in 2022.
108 more All Cause deaths in 2022.
44 more deaths from Unknown Causes (2015-2022)
46 more All Cause deaths over the first 8 years of Newfoundland’s New Normal™.
To show this year’s deaths from Unknown Causes are up 111% compared to Old Normal rates, we need to calculate the rates for both 2022 and for the Old Normal.
Remember, death rates are calculated to answer these questions:
“How many elderly men and women aged 85-89 were there?” and
“How many of them died from Unknown Causes?”
The following 2 charts provide this information:
Deaths – Unknown Causes – Elderly Men And Women – Aged 85-89 | Newfoundland, Canada
Populalation – Elderly Men And Women – Aged 85-89 – [2000-2022] | Newfoundland, Canada
From the charts, we can see that in 2022, 39 of 6,986 elderly men and women aged 85-89 living in Newfoundland died from Unknown Causes.
39 ÷ 6,986 = 0.00558 (2022 CDR)
We’ll use the table below to calculate our Old Normal rate for deaths from Unknown Causes
Old Normal (2001-2014) Newfoundland elderly men and women aged 85-89 Unknown Causes
Year
Pop
Died
From
|2000
4,413
537
12
|2001
4,451
586
13
|2002
4,538
562
13
|2003
4,616
591
15
|2004
4,761
590
12
|Year
Pop
Died
From
|2005
5,051
618
12
|2006
5,266
597
14
|2007
5,525
674
14
|2008
5,548
696
13
|2009
5,504
669
14
|Year
Pop
Died
From
|2010
5,533
640
14
|2011
5,675
705
17
|2012
5,752
678
15
|2013
5,821
685
14
|2014
5,944
698
15
Cumulative:
Population
Deaths
Unknown Causes
Totals:
78,398
9,526
207
The table shows there were a total of 207 deaths from Unknown Causes among 78,398 elderly men and women aged 85-89 living in Newfoundland in the 15 years immediately prior to the New Normal™.
207 ÷ 78,398 = 0.00264 (Old Normal CDR)
We can use the Old Normal rate to predict this year’s deaths:
2022 pop X Old Normal CDR = expected deaths
6,986 X 0.00264 = 18 expected deaths
The difference between actual and expected deaths shows lives saved or lost:
39 – 18 = 21
Dividing the actual deaths by the expected deaths gives us the comparative rates:
39 ÷ 18 = 2.1063
This reveals 21 lives lost and is 210.63% of what we expected (an increase of 111%) in deaths from Unknown Causes among elderly men and women aged 85-89 living in Newfoundland in 2022, as compared to the Old Normal.
Compare our Old Normal to the 5yr CDR. Does it tell the same story your TV does?
5yr CDR (2017-2021)
Year
Pop
Died
From
|2017
6,224
730
17
|2018
6,383
770
20
|2019
6,571
749
21
|2020
6,684
784
22
|2021
6,841
844
26
Total:
44,807
5,382
142
This is the same method used by Public Health to calculate the 5-yr CDR (Cumulative Death Rate):
142 ÷ 44,807 = 0.00317 (5-yr CDR)
6,986(2022 pop) X 0.00317 = 22 expected deaths
The difference between actual and expected deaths:
39 – 22 = 17 or 17 lives lost
Divide actual deaths by expected deaths:
39 ÷ 22 = 1.7560 or an increase of 76%
for deaths from Unknown Causes among elderly men and women aged 85-89 living in Newfoundland in 2022, as compared to the previous 5 years.
Finally, the same method can also be used to compare our Old Normal rate to the New Normal™ rate:
New Normal™ population X Old Normal rate = expected deaths
51,793 X 0.00264 = 137 expected deaths
The difference between actual and expected deaths:
181 – 137 = 44 or 44 lives lost
Dividing the actual deaths by the expected deaths:
181 ÷ 137 = 1.3186 or an increase of 32%
in deaths from Unknown Causes among elderly men and women aged 85-89 living in Newfoundland in the New Normal™, as compared to the Old Normal.
New Normal (2015-2022)
Year
Pop
Died
From
|2015
6,015
799
19
|2016
6,089
706
17
|2017
6,224
730
17
|2018
6,383
770
20
|2019
6,571
749
21
|2020
6,684
784
22
|2021
6,841
844
26
|2022
6,986
957
39
Total:
51,793
6,339
181
The world has been led to believe that a deadly pandemic swept the globe beginning in 2020, causing an increase in death rates, especially among the elderly
The data show that death rates began to increase in 2015, immediately upon implementation of the UN’s 2030 Agenda for Sustainable Development, that young adults have experienced ever-increasing death rates since, and that death rates among the elderly have remained relatively stable.
Browse through the age-categorized charts below to see the evidence of this. Click on any chart to see the full analysis for each age group.
383 of the 6,144 deaths among individuals of all ages living in Newfoundland in 2022 were from Unknown Causes (6.23% of all deaths).
This is up 312% compared to Old Normal (2000-2014) rates which, when applied to the this year's both sexes population of 525,972 individuals would have predicted 88 deaths from Unknown Causes.
This means there were 295 more deaths than expected from Unknown Causes among individuals of all ages living in Newfoundland in 2022.
To date, 803 individual lives have been lost to Unknown Causes over the first 8 years of Newfoundland's New Normal™.
Browse through the age categories below to learn how these deaths from Unknown Causes in 2022 are distributed among each age group of individuals in Newfoundland.
Click the bar graph above to see how both the 2022 loss of 295 lives and the 8-year loss of 803 individual lives from Unknown Causes is arrived at.
The first 4 of the 383 deaths from Unknown Causes in 2022 were among pre-schoolers aged 0-4, accounting for 15.99% of the 25 total deaths in this group.
This is up 377% compared to Old Normal rates which, when applied to this year's population of 19,502 pre-schoolers aged 0-4, would have predicted 1 deaths from Unknown Causes this year.
This means there were 3 more deaths than expected from Unknown Causes among pre-schoolers aged 0-4 living in Newfoundland in 2022.
Overall, 15 deaths from Unknown Causes represent 9 lives lost among pre-schoolers aged 0-4 over the first 8 years of Newfoundland's New Normal™.
Click the bar graph above to see how both the 2022 total of 3 more live lost than expected and the 8 year total of 15 lives lost from Unknown Causes among pre-schoolers aged 0-4 is arrived at.
Yearly Unknown Causes Tally: 4 / 383
The next 0 of the 383 individual deaths from Unknown Causes in 2022 were among children aged 5-9, accounting for 0.00% of the 5 total deaths in this group.
This is down 100% compared to Old Normal rates. Those rates, applied to this year's population of 23,130 children aged 5-9, would have predicted 0 deaths from Unknown Causes this year.
This means there were 0 fewer deaths than expected from Unknown Causes among children aged 5-9 living in Newfoundland in 2022.
Overall, 0 deaths from Unknown Causes represent 0 lives saved among children aged 5-9 over the first 8 years of Newfoundland's New Normal™.
Click the bar graph above to see how the both the 2022 total of 0 fewer and the 8 year total of 0 fewer individual aged 5-9 deaths from Unknown Causes is arrived at.
Yearly Unknown Causes Tally: 4 / 383
The next 1 of the 383 individual deaths from Unknown Causes in 2022 were among children aged 10-14, accounting for 16.64% of the 6 total deaths in this group.
This is up 287% compared to Old Normal rates. Those rates, applied to this year's population of 25,829 children aged 10-14, would have predicted 0 deaths from Unknown Causes this year.
This means there were 1 more deaths than expected from Unknown Causes among children aged 10-14 living in Newfoundland in 2022.
Overall, 1 deaths from Unknown Causes represent 1 lives lost among children aged 10-14 over the first 8 years of Newfoundland's New Normal™.
Click the bar graph above to see how the both the 2022 total of 1 more and the 8 year total of 1 more individual aged 10-14 deaths from Unknown Causes is arrived at.
Yearly Unknown Causes Tally: 5 / 383
The next 4 of the 383 individual deaths from Unknown Causes in 2022 were among teens aged 15-19, accounting for 26.65% of the 15 total deaths in this group.
This is up 639% compared to Old Normal rates. Those rates, applied to this year's population of 27,290 teens aged 15-19, would have predicted 0 deaths from Unknown Causes this year.
This means there were 4 more deaths than expected from Unknown Causes among teens aged 15-19 living in Newfoundland in 2022.
Overall, 10 deaths from Unknown Causes represent 8 lives lost among teens aged 15-19 over the first 8 years of Newfoundland's New Normal™.
Click the bar graph above to see how the both the 2022 total of 4 more and the 8 year total of 10 more individual aged 15-19 deaths from Unknown Causes is arrived at.
Yearly Unknown Causes Tally: 9 / 383
The next 5 of the 383 individual deaths from Unknown Causes in 2022 were among people aged 20-24, accounting for 26.30% of the 19 total deaths in this group.
This is up 732% compared to Old Normal rates. Those rates, applied to this year's population of 30,009 people aged 20-24, would have predicted 0 deaths from Unknown Causes this year.
This means there were 5 more deaths than expected from Unknown Causes among people aged 20-24 living in Newfoundland in 2022.
Overall, 15 deaths from Unknown Causes represent 13 lives lost among people aged 20-24 over the first 8 years of Newfoundland's New Normal™.
Click the bar graph above to see how the both the 2022 total of 5 more and the 8 year total of 15 more individual aged 20-24 deaths from Unknown Causes is arrived at.
Yearly Unknown Causes Tally: 14 / 383
The next 6 of the 383 individual deaths from Unknown Causes in 2022 were among people aged 25-29, accounting for 27.26% of the 22 total deaths in this group.
This is up 738% compared to Old Normal rates. Those rates, applied to this year's population of 28,408 people aged 25-29, would have predicted 0 deaths from Unknown Causes this year.
This means there were 6 more deaths than expected from Unknown Causes among people aged 25-29 living in Newfoundland in 2022.
Overall, 23 deaths from Unknown Causes represent 19 lives lost among people aged 25-29 over the first 8 years of Newfoundland's New Normal™.
Click the bar graph above to see how the both the 2022 total of 6 more and the 8 year total of 23 more individual aged 25-29 deaths from Unknown Causes is arrived at.
Yearly Unknown Causes Tally: 20 / 383
The next 8 of the 383 individual deaths from Unknown Causes in 2022 were among people aged 30-34, accounting for 26.66% of the 30 total deaths in this group.
This is up 802% compared to Old Normal rates. Those rates, applied to this year's population of 29,456 people aged 30-34, would have predicted 1 deaths from Unknown Causes this year.
This means there were 7 more deaths than expected from Unknown Causes among people aged 30-34 living in Newfoundland in 2022.
Overall, 27 deaths from Unknown Causes represent 22 lives lost among people aged 30-34 over the first 8 years of Newfoundland's New Normal™.
Click the bar graph above to see how the both the 2022 total of 7 more and the 8 year total of 27 more individual aged 30-34 deaths from Unknown Causes is arrived at.
Yearly Unknown Causes Tally: 28 / 383
The next 10 of the 383 individual deaths from Unknown Causes in 2022 were among people aged 35-39, accounting for 23.80% of the 42 total deaths in this group.
This is up 732% compared to Old Normal rates. Those rates, applied to this year's population of 29,963 people aged 35-39, would have predicted 1 deaths from Unknown Causes this year.
This means there were 9 more deaths than expected from Unknown Causes among people aged 35-39 living in Newfoundland in 2022.
Overall, 32 deaths from Unknown Causes represent 25 lives lost among people aged 35-39 over the first 8 years of Newfoundland's New Normal™.
Click the bar graph above to see how the both the 2022 total of 9 more and the 8 year total of 32 more individual aged 35-39 deaths from Unknown Causes is arrived at.
Yearly Unknown Causes Tally: 38 / 383
The next 14 of the 383 individual deaths from Unknown Causes in 2022 were among people aged 40-44, accounting for 21.54% of the 65 total deaths in this group.
This is up 772% compared to Old Normal rates. Those rates, applied to this year's population of 30,912 people aged 40-44, would have predicted 1 deaths from Unknown Causes this year.
This means there were 13 more deaths than expected from Unknown Causes among people aged 40-44 living in Newfoundland in 2022.
Overall, 38 deaths from Unknown Causes represent 27 lives lost among people aged 40-44 over the first 8 years of Newfoundland's New Normal™.
Click the bar graph above to see how the both the 2022 total of 13 more and the 8 year total of 38 more individual aged 40-44 deaths from Unknown Causes is arrived at.
Yearly Unknown Causes Tally: 52 / 383
The next 15 of the 383 individual deaths from Unknown Causes in 2022 were among people aged 45-49, accounting for 15.79% of the 95 total deaths in this group.
This is up 559% compared to Old Normal rates. Those rates, applied to this year's population of 33,683 people aged 45-49, would have predicted 2 deaths from Unknown Causes this year.
This means there were 13 more deaths than expected from Unknown Causes among people aged 45-49 living in Newfoundland in 2022.
Overall, 51 deaths from Unknown Causes represent 34 lives lost among people aged 45-49 over the first 8 years of Newfoundland's New Normal™.
Click the bar graph above to see how the both the 2022 total of 13 more and the 8 year total of 51 more individual aged 45-49 deaths from Unknown Causes is arrived at.
Yearly Unknown Causes Tally: 67 / 383
The next 21 of the 383 individual deaths from Unknown Causes in 2022 were among people aged 50-54, accounting for 13.37% of the 157 total deaths in this group.
This is up 635% compared to Old Normal rates. Those rates, applied to this year's population of 39,049 people aged 50-54, would have predicted 2 deaths from Unknown Causes this year.
This means there were 19 more deaths than expected from Unknown Causes among people aged 50-54 living in Newfoundland in 2022.
Overall, 71 deaths from Unknown Causes represent 50 lives lost among people aged 50-54 over the first 8 years of Newfoundland's New Normal™.
Click the bar graph above to see how the both the 2022 total of 19 more and the 8 year total of 71 more individual aged 50-54 deaths from Unknown Causes is arrived at.
Yearly Unknown Causes Tally: 88 / 383
The next 26 of the 383 individual deaths from Unknown Causes in 2022 were among people aged 55-59, accounting for 9.39% of the 277 total deaths in this group.
This is up 626% compared to Old Normal rates. Those rates, applied to this year's population of 42,217 people aged 55-59, would have predicted 3 deaths from Unknown Causes this year.
This means there were 23 more deaths than expected from Unknown Causes among people aged 55-59 living in Newfoundland in 2022.
Overall, 85 deaths from Unknown Causes represent 59 lives lost among people aged 55-59 over the first 8 years of Newfoundland's New Normal™.
Click the bar graph above to see how the both the 2022 total of 23 more and the 8 year total of 85 more individual aged 55-59 deaths from Unknown Causes is arrived at.
Yearly Unknown Causes Tally: 114 / 383
The next 29 of the 383 individual deaths from Unknown Causes in 2022 were among people aged 60-64, accounting for 6.82% of the 425 total deaths in this group.
This is up 568% compared to Old Normal rates. Those rates, applied to this year's population of 42,585 people aged 60-64, would have predicted 4 deaths from Unknown Causes this year.
This means there were 25 more deaths than expected from Unknown Causes among people aged 60-64 living in Newfoundland in 2022.
Overall, 95 deaths from Unknown Causes represent 64 lives lost among people aged 60-64 over the first 8 years of Newfoundland's New Normal™.
Click the bar graph above to see how the both the 2022 total of 25 more and the 8 year total of 95 more individual aged 60-64 deaths from Unknown Causes is arrived at.
Yearly Unknown Causes Tally: 143 / 383
The next 31 of the 383 individual deaths from Unknown Causes in 2022 were among elderly men and women aged 65-69, accounting for 5.39% of the 575 total deaths in this group.
This is up 426% compared to Old Normal rates. Those rates, applied to this year's population of 40,343 elderly men and women aged 65-69, would have predicted 5 deaths from Unknown Causes this year.
This means there were 26 more deaths than expected from Unknown Causes among elderly men and women aged 65-69 living in Newfoundland in 2022.
Overall, 100 deaths from Unknown Causes represent 58 lives lost among elderly men and women aged 65-69 over the first 8 years of Newfoundland's New Normal™.
Click the bar graph above to see how the both the 2022 total of 26 more and the 8 year total of 100 more individual aged 65-69 deaths from Unknown Causes is arrived at.
Yearly Unknown Causes Tally: 174 / 383
The next 34 of the 383 individual deaths from Unknown Causes in 2022 were among elderly men and women aged 70-74, accounting for 4.15% of the 819 total deaths in this group.
This is up 292% compared to Old Normal rates. Those rates, applied to this year's population of 34,780 elderly men and women aged 70-74, would have predicted 8 deaths from Unknown Causes this year.
This means there were 26 more deaths than expected from Unknown Causes among elderly men and women aged 70-74 living in Newfoundland in 2022.
Overall, 110 deaths from Unknown Causes represent 52 lives lost among elderly men and women aged 70-74 over the first 8 years of Newfoundland's New Normal™.
Click the bar graph above to see how the both the 2022 total of 26 more and the 8 year total of 110 more individual aged 70-74 deaths from Unknown Causes is arrived at.
Yearly Unknown Causes Tally: 208 / 383
The next 32 of the 383 individual deaths from Unknown Causes in 2022 were among elderly men and women aged 75-79, accounting for 3.84% of the 834 total deaths in this group.
This is up 144% compared to Old Normal rates. Those rates, applied to this year's population of 24,456 elderly men and women aged 75-79, would have predicted 13 deaths from Unknown Causes this year.
This means there were 19 more deaths than expected from Unknown Causes among elderly men and women aged 75-79 living in Newfoundland in 2022.
Overall, 119 deaths from Unknown Causes represent 37 lives lost among elderly men and women aged 75-79 over the first 8 years of Newfoundland's New Normal™.
Click the bar graph above to see how the both the 2022 total of 19 more and the 8 year total of 119 more individual aged 75-79 deaths from Unknown Causes is arrived at.
Yearly Unknown Causes Tally: 240 / 383
The next 33 of the 383 individual deaths from Unknown Causes in 2022 were among elderly men and women aged 80-84, accounting for 3.55% of the 930 total deaths in this group.
This is up 97% compared to Old Normal rates. Those rates, applied to this year's population of 13,649 elderly men and women aged 80-84, would have predicted 17 deaths from Unknown Causes this year.
This means there were 16 more deaths than expected from Unknown Causes among elderly men and women aged 80-84 living in Newfoundland in 2022.
Overall, 151 deaths from Unknown Causes represent 34 lives lost among elderly men and women aged 80-84 over the first 8 years of Newfoundland's New Normal™.
Click the bar graph above to see how the both the 2022 total of 16 more and the 8 year total of 151 more individual aged 80-84 deaths from Unknown Causes is arrived at.
Yearly Unknown Causes Tally: 273 / 383
The next 33 of the 383 individual deaths from Unknown Causes in 2022 were among elderly men and women aged 80-84, accounting for 3.55% of the 930 total deaths in this group.
This is up 97% compared to Old Normal rates. Those rates, applied to this year's population of 13,649 elderly men and women aged 80-84, would have predicted 17 deaths from Unknown Causes this year.
This means there were 16 more deaths than expected from Unknown Causes among elderly men and women aged 80-84 living in Newfoundland in 2022.
Overall, 151 deaths from Unknown Causes represent 34 lives lost among elderly men and women aged 80-84 over the first 8 years of Newfoundland's New Normal™.
Click the bar graph above to see how the both the 2022 total of 16 more and the 8 year total of 151 more individual aged 80-84 deaths from Unknown Causes is arrived at.
Yearly Unknown Causes Tally: 306 / 383
The next 39 of the 383 individual deaths from Unknown Causes in 2022 were among elderly men and women aged 85-89, accounting for 4.08% of the 957 total deaths in this group.
This is up 111% compared to Old Normal rates. Those rates, applied to this year's population of 6,986 elderly men and women aged 85-89, would have predicted 18 deaths from Unknown Causes this year.
This means there were 21 more deaths than expected from Unknown Causes among elderly men and women aged 85-89 living in Newfoundland in 2022.
Overall, 181 deaths from Unknown Causes represent 44 lives lost among elderly men and women aged 85-89 over the first 8 years of Newfoundland's New Normal™.
Click the bar graph above to see how the both the 2022 total of 21 more and the 8 year total of 181 more individual aged 85-89 deaths from Unknown Causes is arrived at.
Yearly Unknown Causes Tally: 345 / 383
The next 41 of the 383 deaths from Unknown Causes in 2022 were among elderly men and women aged 90+, accounting for 4.85% of the 846 total deaths in this group.
This is up 69% compared to Old Normal rates which, when applied to this year's population of 3,725 would have predicted 24 deaths from Unknown Causes this year.
This means there were 17 more deaths than expected from Unknown Causes among elderly men and women aged 90+ living in Newfoundland in 2022.
Overall, 210 deaths from Unknown Causes represent 28 lives lost among elderly men and women aged 90+ over the first 8 years of Newfoundland's New Normal™.
Click the bar graph above to see how the 8 year total of 210 excess individual deaths from Unknown Causes is arrived at.
Yearly Unknown Causes Tally: 386 / 383*
* Newfoundland does not report the deaths of 3 babies in it's death totals