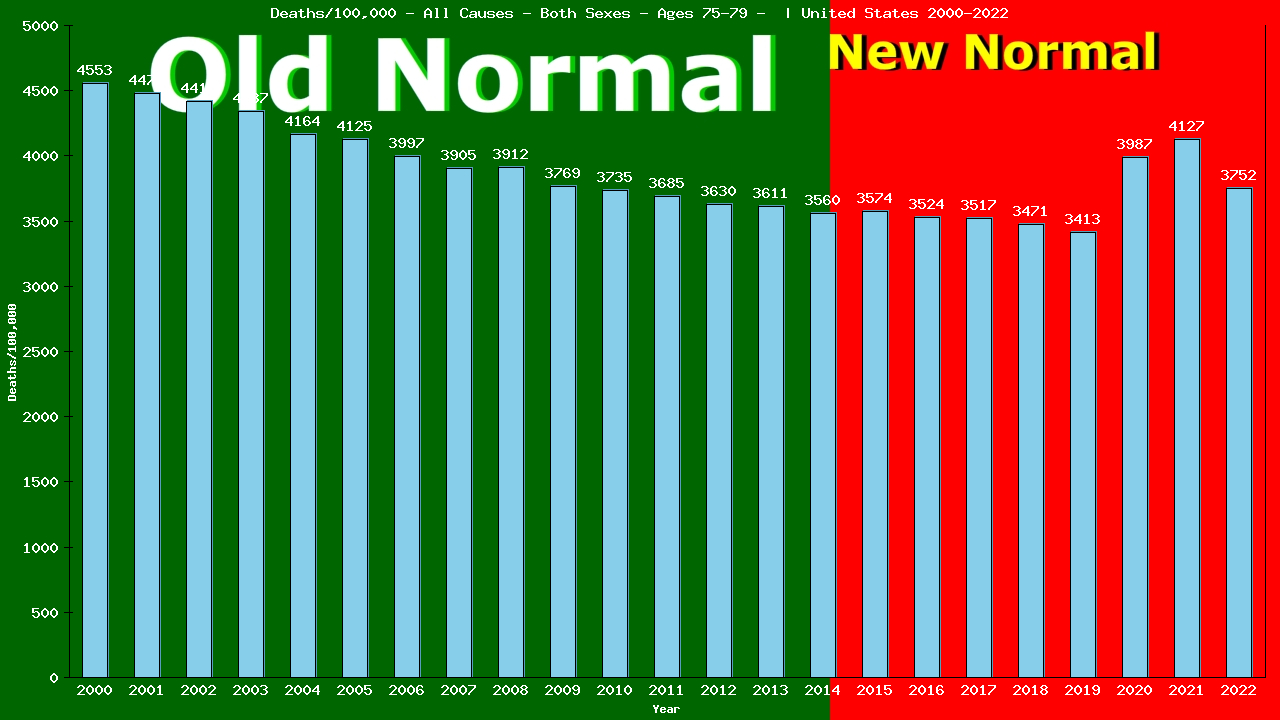
2022 vs New Normal™ for elderly men and women aged 75-79 in United States
407,592 of 407,592 total deaths were from All Causes
100.00% of all deaths were from All Causes
This is down 6% compared to Old Normal rates.
433,414 of 433,414 total deaths would have been expected under Old Normal conditions.
25,822 fewer deaths from All Causes in 2022.
230,452 fewer deaths from All Causes (2015-2022)
To show this year’s deaths from All Causes are down 6% compared to Old Normal rates, we need to calculate the rates for both 2022 and for the Old Normal.
Remember, death rates are calculated to answer these questions:
“How many elderly men and women aged 75-79 were there?” and
“How many of them died from All Causes?”
The following 2 charts provide this information:
Deaths – All Causes – Elderly Men And Women – Aged 75-79 | United States, United-states
Populalation – Elderly Men And Women – Aged 75-79 – [2000-2022] | United States, United-states
From the charts, we can see that in 2022, 407,592 of 10,861,000 elderly men and women aged 75-79 living in United States died from All Causes.
407,592 ÷ 10,861,000 = 0.03753 (2022 CDR)
We’ll use the table below to calculate our Old Normal rate for deaths from All Causes
Old Normal (2001-2014) United States elderly men and women aged 75-79 All Causes
Year
Pop
Died
From
|2000
7,415,813
337,700
337,700
|2001
7,455,413
333,677
333,677
|2002
7,470,461
330,140
330,140
|2003
7,497,842
325,185
325,185
|2004
7,461,399
310,746
310,746
|Year
Pop
Died
From
|2005
7,463,609
307,888
307,888
|2006
7,447,034
297,710
297,710
|2007
7,400,363
289,029
289,029
|2008
7,345,743
287,370
287,370
|2009
7,295,064
274,987
274,987
|Year
Pop
Died
From
|2010
7,317,795
273,348
273,348
|2011
7,388,687
272,276
272,276
|2012
7,489,583
271,936
271,936
|2013
7,677,881
277,314
277,314
|2014
7,922,324
282,072
282,072
Cumulative:
Population
Deaths
All Causes
Totals:
112,049,011
4,471,378
4,471,378
The table shows there were a total of 4,471,378 deaths from All Causes among 112,049,011 elderly men and women aged 75-79 living in United States in the 15 years immediately prior to the New Normal™.
4,471,378 ÷ 112,049,011 = 0.03991 (Old Normal CDR)
We can use the Old Normal rate to predict this year’s deaths:
2022 pop X Old Normal CDR = expected deaths
10,861,000 X 0.03991 = 433,414 expected deaths
The difference between actual and expected deaths shows lives saved or lost:
407,592 – 433,414 = -25,822
Dividing the actual deaths by the expected deaths gives us the comparative rates:
407,592 ÷ 433,414 = 0.9402
This reveals 25,822 lives saved and is 94.02% of what we expected (a decrease of 6%) in deaths from All Causes among elderly men and women aged 75-79 living in United States in 2022, as compared to the Old Normal.
Compare our Old Normal to the 5yr CDR. Does it tell the same story your TV does?
5yr CDR (2017-2021)
Year
Pop
Died
From
|2017
8,741,261
307,498
307,498
|2018
9,267,066
321,745
321,745
|2019
9,652,665
329,493
329,493
|2020
9,986,833
398,191
398,191
|2021
9,904,769
408,867
408,867
Total:
64,044,322
2,351,094
2,351,094
This is the same method used by Public Health to calculate the 5-yr CDR (Cumulative Death Rate):
2,351,094 ÷ 64,044,322 = 0.03671 (5-yr CDR)
10,861,000(2022 pop) X 0.03671 = 398,712 expected deaths
The difference between actual and expected deaths:
407,592 – 398,712 = 8,880 or 8,880 lives lost
Divide actual deaths by expected deaths:
407,592 ÷ 398,712 = 1.0220 or an increase of 2%
for deaths from All Causes among elderly men and women aged 75-79 living in United States in 2022, as compared to the previous 5 years.
Finally, the same method can also be used to compare our Old Normal rate to the New Normal™ rate:
New Normal™ population X Old Normal rate = expected deaths
74,905,322 X 0.03991 = 2,989,138 expected deaths
The difference between actual and expected deaths:
2758686 – 2,989,138 = -230,452 or 230,452 lives saved
Dividing the actual deaths by the expected deaths:
2,758,686 ÷ 2,989,138 = 0.9227 or a decrease of 8%
in deaths from All Causes among elderly men and women aged 75-79 living in United States in the New Normal™, as compared to the Old Normal.
New Normal (2015-2022)
Year
Pop
Died
From
|2015
8,123,833
290,405
290,405
|2016
8,367,895
294,895
294,895
|2017
8,741,261
307,498
307,498
|2018
9,267,066
321,745
321,745
|2019
9,652,665
329,493
329,493
|2020
9,986,833
398,191
398,191
|2021
9,904,769
408,867
408,867
|2022
10,861,000
407,592
407,592
Total:
74,905,322
2,758,686
2,758,686
The world has been led to believe that a deadly pandemic swept the globe beginning in 2020, causing an increase in death rates, especially among the elderly
The data show that death rates began to increase in 2015, immediately upon implementation of the UN’s 2030 Agenda for Sustainable Development, that young adults have experienced ever-increasing death rates since, and that death rates among the elderly have remained relatively stable.
Browse through the age-categorized charts below to see the evidence of this. Click on any chart to see the full analysis for each age group.
3,279,754 of the 3,279,754 deaths among individuals of all ages living in United States in 2022 were from All Causes (100.00% of all deaths).
This is up 20% compared to Old Normal (2000-2014) rates which, when applied to the this year's both sexes population of 326,801,689 individuals would have predicted 2,730,616 deaths from All Causes.
This means there were 549,138 more deaths than expected from All Causes among individuals of all ages living in United States in 2022.
To date, 2,626,332 individual lives have been lost to All Causes over the first 8 years of United States's New Normal™.
Browse through the age categories below to learn how these deaths from All Causes in 2022 are distributed among each age group of individuals in United States.
Click the bar graph above to see how both the 2022 loss of 549,138 lives and the 8-year loss of 2,626,332 individual lives from All Causes is arrived at.
The first 20,553 of the 3,279,754 deaths from All Causes in 2022 were among babies in their first year of life, accounting for 100.00% of the 20,553 total deaths in this group.
This is down 16% compared to Old Normal rates which, when applied to this year's population of 3,683,113 babies in their first year of life, would have predicted 24,550 deaths from All Causes this year.
This means there were 3,997 fewer deaths than expected from All Causes among babies in their first year of life living in United States in 2022.
Overall, 171,394 deaths from All Causes represent 31,915 lives saved among babies in their first year of life over the first 8 years of United States's New Normal™.
Click the bar graph above to see how both the 2022 total of 3,997 fewer live lost than expected and the 8 year total of 171394 lives saved from All Causes among babies in their first year of life is arrived at.
Yearly All Causes Tally: 20,553 / 3,279,754
The next 4,156 of the 3,279,754 individual deaths from All Causes in 2022 were among pre-schoolers aged 1-4, accounting for 100.00% of the 4,156 total deaths in this group.
This is down 6% compared to Old Normal rates. Those rates, applied to this year's population of 14,855,240 pre-schoolers aged 1-4, would have predicted 4,284 deaths from All Causes this year.
This means there were 128 fewer deaths than expected from All Causes among pre-schoolers aged 1-4 living in United States in 2022.
Overall, 30,897 deaths from All Causes represent 5,245 lives saved among pre-schoolers aged 1-4 over the first 8 years of United States's New Normal™.
Click the bar graph above to see how the both the 2022 total of 128 fewer and the 8 year total of 30,897 fewer individual aged 1-4 deaths from All Causes is arrived at.
Yearly All Causes Tally: 24,709 / 3,279,754
The next 2,567 of the 3,279,754 individual deaths from All Causes in 2022 were among children aged 5-9, accounting for 100.00% of the 2,567 total deaths in this group.
This is down 11% compared to Old Normal rates. Those rates, applied to this year's population of 20,009,195 children aged 5-9, would have predicted 2,686 deaths from All Causes this year.
This means there were 119 fewer deaths than expected from All Causes among children aged 5-9 living in United States in 2022.
Overall, 19,092 deaths from All Causes represent 2,672 lives saved among children aged 5-9 over the first 8 years of United States's New Normal™.
Click the bar graph above to see how the both the 2022 total of 119 fewer and the 8 year total of 19,092 fewer individual aged 5-9 deaths from All Causes is arrived at.
Yearly All Causes Tally: 27,276 / 3,279,754
The next 3,672 of the 3,279,754 individual deaths from All Causes in 2022 were among children aged 10-14, accounting for 100.00% of the 3,672 total deaths in this group.
This is up 0% compared to Old Normal rates. Those rates, applied to this year's population of 20,889,839 children aged 10-14, would have predicted 3,450 deaths from All Causes this year.
This means there were 222 more deaths than expected from All Causes among children aged 10-14 living in United States in 2022.
Overall, 26,177 deaths from All Causes represent 1,367 lives saved among children aged 10-14 over the first 8 years of United States's New Normal™.
Click the bar graph above to see how the both the 2022 total of 222 more and the 8 year total of 26,177 more individual aged 10-14 deaths from All Causes is arrived at.
Yearly All Causes Tally: 30,948 / 3,279,754
The next 12,745 of the 3,279,754 individual deaths from All Causes in 2022 were among teens aged 15-19, accounting for 100.00% of the 12,745 total deaths in this group.
This is up 1% compared to Old Normal rates. Those rates, applied to this year's population of 21,635,792 teens aged 15-19, would have predicted 12,399 deaths from All Causes this year.
This means there were 346 more deaths than expected from All Causes among teens aged 15-19 living in United States in 2022.
Overall, 90,952 deaths from All Causes represent 6,294 lives saved among teens aged 15-19 over the first 8 years of United States's New Normal™.
Click the bar graph above to see how the both the 2022 total of 346 more and the 8 year total of 90,952 more individual aged 15-19 deaths from All Causes is arrived at.
Yearly All Causes Tally: 43,693 / 3,279,754
The next 22,487 of the 3,279,754 individual deaths from All Causes in 2022 were among people aged 20-24, accounting for 100.00% of the 22,487 total deaths in this group.
This is up 7% compared to Old Normal rates. Those rates, applied to this year's population of 22,705,779 people aged 20-24, would have predicted 20,807 deaths from All Causes this year.
This means there were 1,680 more deaths than expected from All Causes among people aged 20-24 living in United States in 2022.
Overall, 173,422 deaths from All Causes represent 11,620 lives lost among people aged 20-24 over the first 8 years of United States's New Normal™.
Click the bar graph above to see how the both the 2022 total of 1,680 more and the 8 year total of 173,422 more individual aged 20-24 deaths from All Causes is arrived at.
Yearly All Causes Tally: 66,180 / 3,279,754
The next 31,295 of the 3,279,754 individual deaths from All Causes in 2022 were among people aged 25-29, accounting for 100.00% of the 31,295 total deaths in this group.
This is up 42% compared to Old Normal rates. Those rates, applied to this year's population of 22,193,164 people aged 25-29, would have predicted 21,769 deaths from All Causes this year.
This means there were 9,526 more deaths than expected from All Causes among people aged 25-29 living in United States in 2022.
Overall, 232,843 deaths from All Causes represent 52,740 lives lost among people aged 25-29 over the first 8 years of United States's New Normal™.
Click the bar graph above to see how the both the 2022 total of 9,526 more and the 8 year total of 232,843 more individual aged 25-29 deaths from All Causes is arrived at.
Yearly All Causes Tally: 97,475 / 3,279,754
The next 43,074 of the 3,279,754 individual deaths from All Causes in 2022 were among people aged 30-34, accounting for 100.00% of the 43,074 total deaths in this group.
This is up 62% compared to Old Normal rates. Those rates, applied to this year's population of 23,308,136 people aged 30-34, would have predicted 26,292 deaths from All Causes this year.
This means there were 16,782 more deaths than expected from All Causes among people aged 30-34 living in United States in 2022.
Overall, 284,656 deaths from All Causes represent 82,457 lives lost among people aged 30-34 over the first 8 years of United States's New Normal™.
Click the bar graph above to see how the both the 2022 total of 16,782 more and the 8 year total of 284,656 more individual aged 30-34 deaths from All Causes is arrived at.
Yearly All Causes Tally: 140,549 / 3,279,754
The next 50,472 of the 3,279,754 individual deaths from All Causes in 2022 were among people aged 35-39, accounting for 100.00% of the 50,472 total deaths in this group.
This is up 50% compared to Old Normal rates. Those rates, applied to this year's population of 22,267,949 people aged 35-39, would have predicted 33,408 deaths from All Causes this year.
This means there were 17,064 more deaths than expected from All Causes among people aged 35-39 living in United States in 2022.
Overall, 334,806 deaths from All Causes represent 76,641 lives lost among people aged 35-39 over the first 8 years of United States's New Normal™.
Click the bar graph above to see how the both the 2022 total of 17,064 more and the 8 year total of 334,806 more individual aged 35-39 deaths from All Causes is arrived at.
Yearly All Causes Tally: 191,021 / 3,279,754
The next 61,133 of the 3,279,754 individual deaths from All Causes in 2022 were among people aged 40-44, accounting for 100.00% of the 61,133 total deaths in this group.
This is up 28% compared to Old Normal rates. Those rates, applied to this year's population of 21,427,416 people aged 40-44, would have predicted 47,623 deaths from All Causes this year.
This means there were 13,510 more deaths than expected from All Causes among people aged 40-44 living in United States in 2022.
Overall, 400,270 deaths from All Causes represent 40,151 lives lost among people aged 40-44 over the first 8 years of United States's New Normal™.
Click the bar graph above to see how the both the 2022 total of 13,510 more and the 8 year total of 400,270 more individual aged 40-44 deaths from All Causes is arrived at.
Yearly All Causes Tally: 252,154 / 3,279,754
The next 73,143 of the 3,279,754 individual deaths from All Causes in 2022 were among people aged 45-49, accounting for 100.00% of the 73,143 total deaths in this group.
This is up 10% compared to Old Normal rates. Those rates, applied to this year's population of 19,624,098 people aged 45-49, would have predicted 66,538 deaths from All Causes this year.
This means there were 6,605 more deaths than expected from All Causes among people aged 45-49 living in United States in 2022.
Overall, 559,990 deaths from All Causes represent 6,312 lives lost among people aged 45-49 over the first 8 years of United States's New Normal™.
Click the bar graph above to see how the both the 2022 total of 6,605 more and the 8 year total of 559,990 more individual aged 45-49 deaths from All Causes is arrived at.
Yearly All Causes Tally: 325,297 / 3,279,754
The next 110,141 of the 3,279,754 individual deaths from All Causes in 2022 were among people aged 50-54, accounting for 100.00% of the 110,141 total deaths in this group.
This is up 5% compared to Old Normal rates. Those rates, applied to this year's population of 20,807,547 people aged 50-54, would have predicted 104,795 deaths from All Causes this year.
This means there were 5,346 more deaths than expected from All Causes among people aged 50-54 living in United States in 2022.
Overall, 873,855 deaths from All Causes represent 22,475 lives lost among people aged 50-54 over the first 8 years of United States's New Normal™.
Click the bar graph above to see how the both the 2022 total of 5,346 more and the 8 year total of 873,855 more individual aged 50-54 deaths from All Causes is arrived at.
Yearly All Causes Tally: 435,438 / 3,279,754
The next 168,323 of the 3,279,754 individual deaths from All Causes in 2022 were among people aged 55-59, accounting for 100.00% of the 168,323 total deaths in this group.
This is up 10% compared to Old Normal rates. Those rates, applied to this year's population of 20,967,014 people aged 55-59, would have predicted 153,351 deaths from All Causes this year.
This means there were 14,972 more deaths than expected from All Causes among people aged 55-59 living in United States in 2022.
Overall, 1,352,408 deaths from All Causes represent 81,605 lives lost among people aged 55-59 over the first 8 years of United States's New Normal™.
Click the bar graph above to see how the both the 2022 total of 14,972 more and the 8 year total of 1,352,408 more individual aged 55-59 deaths from All Causes is arrived at.
Yearly All Causes Tally: 603,761 / 3,279,754
The next 249,218 of the 3,279,754 individual deaths from All Causes in 2022 were among people aged 60-64, accounting for 100.00% of the 249,218 total deaths in this group.
This is up 9% compared to Old Normal rates. Those rates, applied to this year's population of 21,118,423 people aged 60-64, would have predicted 227,975 deaths from All Causes this year.
This means there were 21,243 more deaths than expected from All Causes among people aged 60-64 living in United States in 2022.
Overall, 1,829,862 deaths from All Causes represent 74,601 lives lost among people aged 60-64 over the first 8 years of United States's New Normal™.
Click the bar graph above to see how the both the 2022 total of 21,243 more and the 8 year total of 1,829,862 more individual aged 60-64 deaths from All Causes is arrived at.
Yearly All Causes Tally: 852,979 / 3,279,754
The next 306,165 of the 3,279,754 individual deaths from All Causes in 2022 were among elderly men and women aged 65-69, accounting for 100.00% of the 306,165 total deaths in this group.
This is up 2% compared to Old Normal rates. Those rates, applied to this year's population of 18,631,422 elderly men and women aged 65-69, would have predicted 300,618 deaths from All Causes this year.
This means there were 5,547 more deaths than expected from All Causes among elderly men and women aged 65-69 living in United States in 2022.
Overall, 2,179,419 deaths from All Causes represent 66,012 lives saved among elderly men and women aged 65-69 over the first 8 years of United States's New Normal™.
Click the bar graph above to see how the both the 2022 total of 5,547 more and the 8 year total of 2,179,419 more individual aged 65-69 deaths from All Causes is arrived at.
Yearly All Causes Tally: 1,159,144 / 3,279,754
The next 362,416 of the 3,279,754 individual deaths from All Causes in 2022 were among elderly men and women aged 70-74, accounting for 100.00% of the 362,416 total deaths in this group.
This is down 5% compared to Old Normal rates. Those rates, applied to this year's population of 15,157,017 elderly men and women aged 70-74, would have predicted 380,527 deaths from All Causes this year.
This means there were 18,111 fewer deaths than expected from All Causes among elderly men and women aged 70-74 living in United States in 2022.
Overall, 2,525,978 deaths from All Causes represent 202,476 lives saved among elderly men and women aged 70-74 over the first 8 years of United States's New Normal™.
Click the bar graph above to see how the both the 2022 total of 18,111 fewer and the 8 year total of 2,525,978 fewer individual aged 70-74 deaths from All Causes is arrived at.
Yearly All Causes Tally: 1,521,560 / 3,279,754
The next 407,592 of the 3,279,754 individual deaths from All Causes in 2022 were among elderly men and women aged 75-79, accounting for 100.00% of the 407,592 total deaths in this group.
This is down 6% compared to Old Normal rates. Those rates, applied to this year's population of 10,861,000 elderly men and women aged 75-79, would have predicted 433,414 deaths from All Causes this year.
This means there were 25,822 fewer deaths than expected from All Causes among elderly men and women aged 75-79 living in United States in 2022.
Overall, 2,758,686 deaths from All Causes represent 230,452 lives saved among elderly men and women aged 75-79 over the first 8 years of United States's New Normal™.
Click the bar graph above to see how the both the 2022 total of 25,822 fewer and the 8 year total of 2,758,686 fewer individual aged 75-79 deaths from All Causes is arrived at.
Yearly All Causes Tally: 1,929,152 / 3,279,754
The next 417,311 of the 3,279,754 individual deaths from All Causes in 2022 were among elderly men and women aged 80-84, accounting for 100.00% of the 417,311 total deaths in this group.
This is down 4% compared to Old Normal rates. Those rates, applied to this year's population of 6,659,545 elderly men and women aged 80-84, would have predicted 433,257 deaths from All Causes this year.
This means there were 15,946 fewer deaths than expected from All Causes among elderly men and women aged 80-84 living in United States in 2022.
Overall, 3,013,427 deaths from All Causes represent 206,971 lives saved among elderly men and women aged 80-84 over the first 8 years of United States's New Normal™.
Click the bar graph above to see how the both the 2022 total of 15,946 fewer and the 8 year total of 3,013,427 fewer individual aged 80-84 deaths from All Causes is arrived at.
Yearly All Causes Tally: 2,346,463 / 3,279,754
The next 1,350,602 of the 3,279,754 deaths from All Causes in 2022 were among elderly men and women aged 80+, accounting for 100.00% of the 1,350,602 total deaths in this group.
This is up 3% compared to Old Normal rates which, when applied to this year's population of 6,659,545 would have predicted 1,307,936 deaths from All Causes this year.
This means there were 42,666 more deaths than expected from All Causes among elderly men and women aged 80+ living in United States in 2022.
Overall, 10,246,527 deaths from All Causes represent 524,646 lives lost among elderly men and women aged 80+ over the first 8 years of United States's New Normal™.
Click the bar graph above to see how the 8 year total of 10,246,527 excess individual deaths from All Causes is arrived at.
Yearly All Causes Tally: 3,697,065 / 3,279,754*
* United States does not report the deaths of 417,311 babies in it's death totals