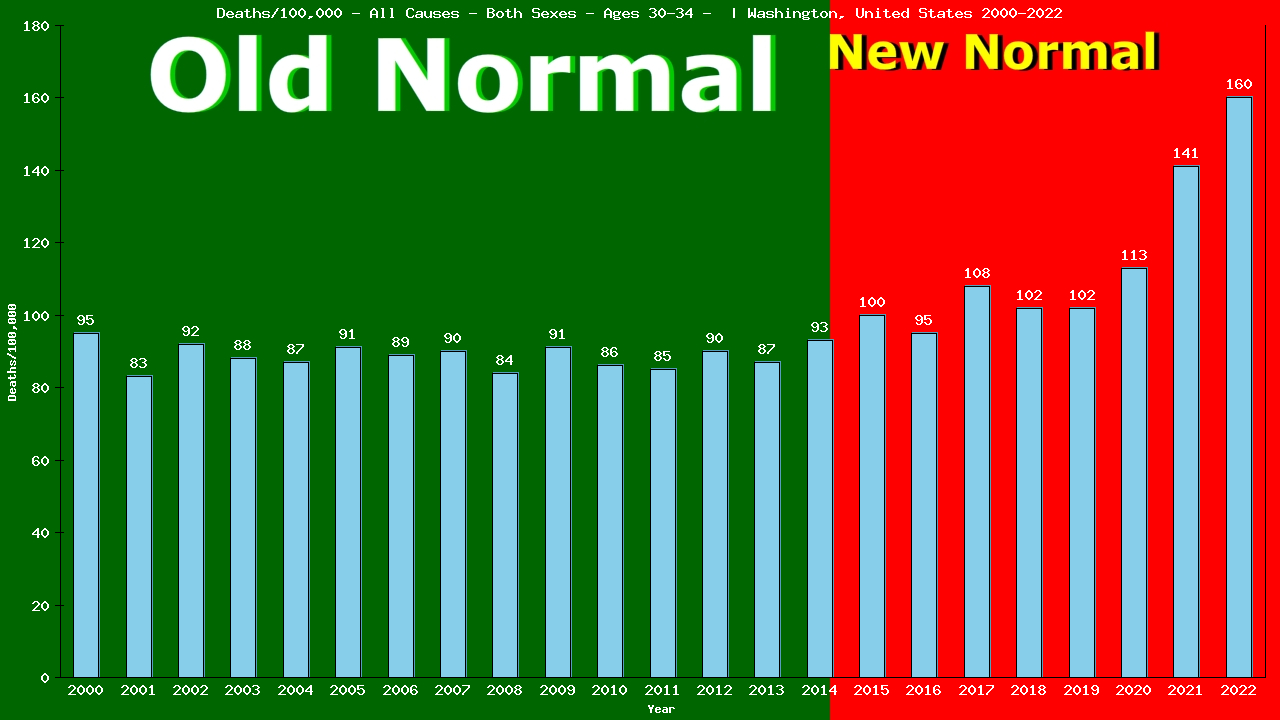
2022 vs New Normal™ for people aged 30-34 in Washington
998 of 998 total deaths were from All Causes
100.00% of all deaths were from All Causes
This is up 78% compared to Old Normal rates.
554 of 554 total deaths would have been expected under Old Normal conditions.
444 more deaths from All Causes in 2022.
1,264 more deaths from All Causes (2015-2022)
To show this year’s deaths from All Causes are up 78% compared to Old Normal rates, we need to calculate the rates for both 2022 and for the Old Normal.
Remember, death rates are calculated to answer these questions:
“How many people aged 30-34 were there?” and
“How many of them died from All Causes?”
The following 2 charts provide this information:
Deaths – All Causes – Male – Aged 30-34 | Washington, United-states
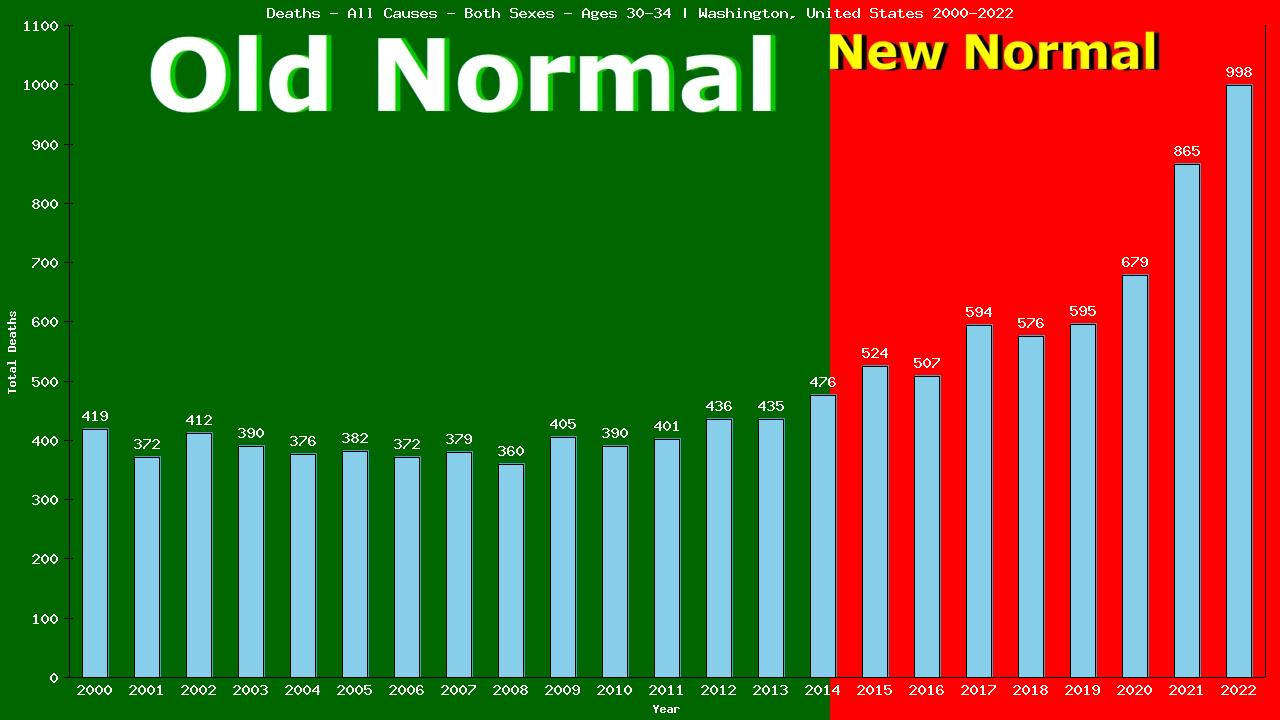
From the charts, we can see that in 2022, 998 of 620,582 people aged 30-34 living in Washington died from All Causes.
998 ÷ 620,582 = 0.00161 (2022 CDR)
We’ll use the table below to calculate our Old Normal rate for deaths from All Causes
Old Normal (2001-2014) Washington male aged 30-34 All Causes
Year
Pop
Died
From
|2000
437,478
419
419
|2001
444,520
372
372
|2002
446,167
412
412
|2003
438,279
390
390
|2004
430,427
376
376
|Year
Pop
Died
From
|2005
419,389
382
382
|2006
414,996
372
372
|2007
417,319
379
379
|2008
427,914
360
360
|2009
442,741
405
405
|Year
Pop
Died
From
|2010
453,383
390
390
|2011
471,175
401
401
|2012
483,925
436
436
|2013
496,976
435
435
|2014
507,466
476
476
Cumulative:
Population
Deaths
All Causes
Totals:
6,732,155
6,005
6,005
The table shows there were a total of 6,005 deaths from All Causes among 6,732,155 people aged 30-34 living in Washington in the 15 years immediately prior to the New Normal™.
6,005 ÷ 6,732,155 = 0.00089 (Old Normal CDR)
We can use the Old Normal rate to predict this year’s deaths:
2022 pop X Old Normal CDR = expected deaths
620,582 X 0.00089 = 554 expected deaths
The difference between actual and expected deaths shows lives saved or lost:
998 – 554 = 444
Dividing the actual deaths by the expected deaths gives us the comparative rates:
998 ÷ 554 = 1.7829
This reveals 444 lives lost and is 178.29% of what we expected (an increase of 78%) in deaths from All Causes among people aged 30-34 living in Washington in 2022, as compared to the Old Normal.
Compare our Old Normal to the 5yr CDR. Does it tell the same story your TV does?
5yr CDR (2017-2021)
Year
Pop
Died
From
|2017
545,545
594
594
|2018
563,753
576
576
|2019
579,479
595
595
|2020
599,790
679
679
|2021
609,397
865
865
Total:
3,946,609
4,340
4,340
This is the same method used by Public Health to calculate the 5-yr CDR (Cumulative Death Rate):
4,340 ÷ 3,946,609 = 0.00110 (5-yr CDR)
620,582(2022 pop) X 0.00110 = 682 expected deaths
The difference between actual and expected deaths:
998 – 682 = 316 or 316 lives lost
Divide actual deaths by expected deaths:
998 ÷ 682 = 1.4492 or an increase of 45%
for deaths from All Causes among people aged 30-34 living in Washington in 2022, as compared to the previous 5 years.
Finally, the same method can also be used to compare our Old Normal rate to the New Normal™ rate:
New Normal™ population X Old Normal rate = expected deaths
4,567,191 X 0.00089 = 4,074 expected deaths
The difference between actual and expected deaths:
5338 – 4,074 = 1,264 or 1,264 lives lost
Dividing the actual deaths by the expected deaths:
5,338 ÷ 4,074 = 1.2958 or an increase of 30%
in deaths from All Causes among people aged 30-34 living in Washington in the New Normal™, as compared to the Old Normal.
New Normal (2015-2022)
Year
Pop
Died
From
|2015
519,138
524
524
|2016
529,507
507
507
|2017
545,545
594
594
|2018
563,753
576
576
|2019
579,479
595
595
|2020
599,790
679
679
|2021
609,397
865
865
|2022
620,582
998
998
Total:
4,567,191
5,338
5,338
The world has been led to believe that a deadly pandemic swept the globe beginning in 2020, causing an increase in death rates, especially among the elderly
The data show that death rates began to increase in 2015, immediately upon implementation of the UN’s 2030 Agenda for Sustainable Development, that young adults have experienced ever-increasing death rates since, and that death rates among the elderly have remained relatively stable.
Browse through the age-categorized charts below to see the evidence of this. Click on any chart to see the full analysis for each age group.
69,191 of the 69,191 deaths among individuals of all ages living in Washington in 2022 were from All Causes (100.00% of all deaths).
This is up 21% compared to Old Normal (2000-2014) rates which, when applied to the this year's both sexes population of 7,650,667 individuals would have predicted 57,122 deaths from All Causes.
This means there were 12,069 more deaths than expected from All Causes among individuals of all ages living in Washington in 2022.
To date, 40,675 individual lives have been lost to All Causes over the first 8 years of Washington's New Normal™.
Browse through the age categories below to learn how these deaths from All Causes in 2022 are distributed among each age group of individuals in Washington.
Click the bar graph above to see how both the 2022 loss of 12,069 lives and the 8-year loss of 40,675 individual lives from All Causes is arrived at.
The first 360 of the 69,191 deaths from All Causes in 2022 were among babies in their first year of life, accounting for 100.00% of the 360 total deaths in this group.
This is down 16% compared to Old Normal rates which, when applied to this year's population of 84,431 babies in their first year of life, would have predicted 428 deaths from All Causes this year.
This means there were 68 fewer deaths than expected from All Causes among babies in their first year of life living in Washington in 2022.
Overall, 3,022 deaths from All Causes represent 536 lives saved among babies in their first year of life over the first 8 years of Washington's New Normal™.
Click the bar graph above to see how both the 2022 total of 68 fewer live lost than expected and the 8 year total of 3022 lives saved from All Causes among babies in their first year of life is arrived at.
Yearly All Causes Tally: 360 / 69,191
The next 88 of the 69,191 individual deaths from All Causes in 2022 were among pre-schoolers aged 1-4, accounting for 99.99% of the 88 total deaths in this group.
This is up 10% compared to Old Normal rates. Those rates, applied to this year's population of 341,398 pre-schoolers aged 1-4, would have predicted 76 deaths from All Causes this year.
This means there were 12 more deaths than expected from All Causes among pre-schoolers aged 1-4 living in Washington in 2022.
Overall, 552 deaths from All Causes represent 94 lives saved among pre-schoolers aged 1-4 over the first 8 years of Washington's New Normal™.
Click the bar graph above to see how the both the 2022 total of 12 more and the 8 year total of 552 more individual aged 1-4 deaths from All Causes is arrived at.
Yearly All Causes Tally: 448 / 69,191
The next 49 of the 69,191 individual deaths from All Causes in 2022 were among children aged 5-9, accounting for 99.98% of the 49 total deaths in this group.
This is down 14% compared to Old Normal rates. Those rates, applied to this year's population of 462,468 children aged 5-9, would have predicted 53 deaths from All Causes this year.
This means there were 4 fewer deaths than expected from All Causes among children aged 5-9 living in Washington in 2022.
Overall, 338 deaths from All Causes represent 85 lives saved among children aged 5-9 over the first 8 years of Washington's New Normal™.
Click the bar graph above to see how the both the 2022 total of 4 fewer and the 8 year total of 338 fewer individual aged 5-9 deaths from All Causes is arrived at.
Yearly All Causes Tally: 497 / 69,191
The next 69 of the 69,191 individual deaths from All Causes in 2022 were among children aged 10-14, accounting for 99.99% of the 69 total deaths in this group.
This is up 1% compared to Old Normal rates. Those rates, applied to this year's population of 473,078 children aged 10-14, would have predicted 65 deaths from All Causes this year.
This means there were 4 more deaths than expected from All Causes among children aged 10-14 living in Washington in 2022.
Overall, 507 deaths from All Causes represent 1 lives saved among children aged 10-14 over the first 8 years of Washington's New Normal™.
Click the bar graph above to see how the both the 2022 total of 4 more and the 8 year total of 507 more individual aged 10-14 deaths from All Causes is arrived at.
Yearly All Causes Tally: 566 / 69,191
The next 240 of the 69,191 individual deaths from All Causes in 2022 were among teens aged 15-19, accounting for 100.00% of the 240 total deaths in this group.
This is up 3% compared to Old Normal rates. Those rates, applied to this year's population of 459,601 teens aged 15-19, would have predicted 228 deaths from All Causes this year.
This means there were 12 more deaths than expected from All Causes among teens aged 15-19 living in Washington in 2022.
Overall, 1,802 deaths from All Causes represent 21 lives lost among teens aged 15-19 over the first 8 years of Washington's New Normal™.
Click the bar graph above to see how the both the 2022 total of 12 more and the 8 year total of 1,802 more individual aged 15-19 deaths from All Causes is arrived at.
Yearly All Causes Tally: 806 / 69,191
The next 479 of the 69,191 individual deaths from All Causes in 2022 were among people aged 20-24, accounting for 100.00% of the 479 total deaths in this group.
This is up 24% compared to Old Normal rates. Those rates, applied to this year's population of 502,795 people aged 20-24, would have predicted 382 deaths from All Causes this year.
This means there were 97 more deaths than expected from All Causes among people aged 20-24 living in Washington in 2022.
Overall, 3,284 deaths from All Causes represent 328 lives lost among people aged 20-24 over the first 8 years of Washington's New Normal™.
Click the bar graph above to see how the both the 2022 total of 97 more and the 8 year total of 3,284 more individual aged 20-24 deaths from All Causes is arrived at.
Yearly All Causes Tally: 1,285 / 69,191
The next 661 of the 69,191 individual deaths from All Causes in 2022 were among people aged 25-29, accounting for 100.00% of the 661 total deaths in this group.
This is up 51% compared to Old Normal rates. Those rates, applied to this year's population of 561,023 people aged 25-29, would have predicted 433 deaths from All Causes this year.
This means there were 228 more deaths than expected from All Causes among people aged 25-29 living in Washington in 2022.
Overall, 4,342 deaths from All Causes represent 828 lives lost among people aged 25-29 over the first 8 years of Washington's New Normal™.
Click the bar graph above to see how the both the 2022 total of 228 more and the 8 year total of 4,342 more individual aged 25-29 deaths from All Causes is arrived at.
Yearly All Causes Tally: 1,946 / 69,191
The next 998 of the 69,191 individual deaths from All Causes in 2022 were among people aged 30-34, accounting for 100.00% of the 998 total deaths in this group.
This is up 78% compared to Old Normal rates. Those rates, applied to this year's population of 620,582 people aged 30-34, would have predicted 554 deaths from All Causes this year.
This means there were 444 more deaths than expected from All Causes among people aged 30-34 living in Washington in 2022.
Overall, 5,338 deaths from All Causes represent 1,264 lives lost among people aged 30-34 over the first 8 years of Washington's New Normal™.
Click the bar graph above to see how the both the 2022 total of 444 more and the 8 year total of 5,338 more individual aged 30-34 deaths from All Causes is arrived at.
Yearly All Causes Tally: 2,944 / 69,191
The next 1,064 of the 69,191 individual deaths from All Causes in 2022 were among people aged 35-39, accounting for 100.00% of the 1,064 total deaths in this group.
This is up 55% compared to Old Normal rates. Those rates, applied to this year's population of 579,368 people aged 35-39, would have predicted 680 deaths from All Causes this year.
This means there were 384 more deaths than expected from All Causes among people aged 35-39 living in Washington in 2022.
Overall, 6,203 deaths from All Causes represent 1,169 lives lost among people aged 35-39 over the first 8 years of Washington's New Normal™.
Click the bar graph above to see how the both the 2022 total of 384 more and the 8 year total of 6,203 more individual aged 35-39 deaths from All Causes is arrived at.
Yearly All Causes Tally: 4,008 / 69,191
The next 1,261 of the 69,191 individual deaths from All Causes in 2022 were among people aged 40-44, accounting for 100.00% of the 1,261 total deaths in this group.
This is up 32% compared to Old Normal rates. Those rates, applied to this year's population of 530,134 people aged 40-44, would have predicted 950 deaths from All Causes this year.
This means there were 311 more deaths than expected from All Causes among people aged 40-44 living in Washington in 2022.
Overall, 7,410 deaths from All Causes represent 524 lives lost among people aged 40-44 over the first 8 years of Washington's New Normal™.
Click the bar graph above to see how the both the 2022 total of 311 more and the 8 year total of 7,410 more individual aged 40-44 deaths from All Causes is arrived at.
Yearly All Causes Tally: 5,269 / 69,191
The next 1,401 of the 69,191 individual deaths from All Causes in 2022 were among people aged 45-49, accounting for 100.00% of the 1,401 total deaths in this group.
This is up 10% compared to Old Normal rates. Those rates, applied to this year's population of 456,932 people aged 45-49, would have predicted 1,274 deaths from All Causes this year.
This means there were 127 more deaths than expected from All Causes among people aged 45-49 living in Washington in 2022.
Overall, 10,228 deaths from All Causes represent 158 lives saved among people aged 45-49 over the first 8 years of Washington's New Normal™.
Click the bar graph above to see how the both the 2022 total of 127 more and the 8 year total of 10,228 more individual aged 45-49 deaths from All Causes is arrived at.
Yearly All Causes Tally: 6,670 / 69,191
The next 2,276 of the 69,191 individual deaths from All Causes in 2022 were among people aged 50-54, accounting for 100.00% of the 2,276 total deaths in this group.
This is up 13% compared to Old Normal rates. Those rates, applied to this year's population of 473,351 people aged 50-54, would have predicted 2,002 deaths from All Causes this year.
This means there were 274 more deaths than expected from All Causes among people aged 50-54 living in Washington in 2022.
Overall, 16,436 deaths from All Causes represent 552 lives lost among people aged 50-54 over the first 8 years of Washington's New Normal™.
Click the bar graph above to see how the both the 2022 total of 274 more and the 8 year total of 16,436 more individual aged 50-54 deaths from All Causes is arrived at.
Yearly All Causes Tally: 8,946 / 69,191
The next 3,238 of the 69,191 individual deaths from All Causes in 2022 were among people aged 55-59, accounting for 100.00% of the 3,238 total deaths in this group.
This is up 13% compared to Old Normal rates. Those rates, applied to this year's population of 459,024 people aged 55-59, would have predicted 2,850 deaths from All Causes this year.
This means there were 388 more deaths than expected from All Causes among people aged 55-59 living in Washington in 2022.
Overall, 25,128 deaths from All Causes represent 1,138 lives lost among people aged 55-59 over the first 8 years of Washington's New Normal™.
Click the bar graph above to see how the both the 2022 total of 388 more and the 8 year total of 25,128 more individual aged 55-59 deaths from All Causes is arrived at.
Yearly All Causes Tally: 12,184 / 69,191
The next 5,046 of the 69,191 individual deaths from All Causes in 2022 were among people aged 60-64, accounting for 100.00% of the 5,046 total deaths in this group.
This is up 13% compared to Old Normal rates. Those rates, applied to this year's population of 473,041 people aged 60-64, would have predicted 4,473 deaths from All Causes this year.
This means there were 573 more deaths than expected from All Causes among people aged 60-64 living in Washington in 2022.
Overall, 36,008 deaths from All Causes represent 761 lives lost among people aged 60-64 over the first 8 years of Washington's New Normal™.
Click the bar graph above to see how the both the 2022 total of 573 more and the 8 year total of 36,008 more individual aged 60-64 deaths from All Causes is arrived at.
Yearly All Causes Tally: 17,230 / 69,191
The next 6,370 of the 69,191 individual deaths from All Causes in 2022 were among elderly men and women aged 65-69, accounting for 100.00% of the 6,370 total deaths in this group.
This is up 2% compared to Old Normal rates. Those rates, applied to this year's population of 431,631 elderly men and women aged 65-69, would have predicted 6,267 deaths from All Causes this year.
This means there were 103 more deaths than expected from All Causes among elderly men and women aged 65-69 living in Washington in 2022.
Overall, 44,259 deaths from All Causes represent 2,864 lives saved among elderly men and women aged 65-69 over the first 8 years of Washington's New Normal™.
Click the bar graph above to see how the both the 2022 total of 103 more and the 8 year total of 44,259 more individual aged 65-69 deaths from All Causes is arrived at.
Yearly All Causes Tally: 23,600 / 69,191
The next 7,650 of the 69,191 individual deaths from All Causes in 2022 were among elderly men and women aged 70-74, accounting for 100.00% of the 7,650 total deaths in this group.
This is down 8% compared to Old Normal rates. Those rates, applied to this year's population of 352,951 elderly men and women aged 70-74, would have predicted 8,335 deaths from All Causes this year.
This means there were 685 fewer deaths than expected from All Causes among elderly men and women aged 70-74 living in Washington in 2022.
Overall, 51,533 deaths from All Causes represent 7,177 lives saved among elderly men and women aged 70-74 over the first 8 years of Washington's New Normal™.
Click the bar graph above to see how the both the 2022 total of 685 fewer and the 8 year total of 51,533 fewer individual aged 70-74 deaths from All Causes is arrived at.
Yearly All Causes Tally: 31,250 / 69,191
The next 8,812 of the 69,191 individual deaths from All Causes in 2022 were among elderly men and women aged 75-79, accounting for 100.00% of the 8,812 total deaths in this group.
This is down 7% compared to Old Normal rates. Those rates, applied to this year's population of 247,207 elderly men and women aged 75-79, would have predicted 9,478 deaths from All Causes this year.
This means there were 666 fewer deaths than expected from All Causes among elderly men and women aged 75-79 living in Washington in 2022.
Overall, 55,264 deaths from All Causes represent 6,985 lives saved among elderly men and women aged 75-79 over the first 8 years of Washington's New Normal™.
Click the bar graph above to see how the both the 2022 total of 666 fewer and the 8 year total of 55,264 fewer individual aged 75-79 deaths from All Causes is arrived at.
Yearly All Causes Tally: 40,062 / 69,191
The next 8,893 of the 69,191 individual deaths from All Causes in 2022 were among elderly men and women aged 80-84, accounting for 100.00% of the 8,893 total deaths in this group.
This is down 1% compared to Old Normal rates. Those rates, applied to this year's population of 141,652 elderly men and women aged 80-84, would have predicted 9,001 deaths from All Causes this year.
This means there were 108 fewer deaths than expected from All Causes among elderly men and women aged 80-84 living in Washington in 2022.
Overall, 59,415 deaths from All Causes represent 4,680 lives saved among elderly men and women aged 80-84 over the first 8 years of Washington's New Normal™.
Click the bar graph above to see how the both the 2022 total of 108 fewer and the 8 year total of 59,415 fewer individual aged 80-84 deaths from All Causes is arrived at.
Yearly All Causes Tally: 48,955 / 69,191
The next 29,129 of the 69,191 deaths from All Causes in 2022 were among elderly men and women aged 80+, accounting for 100.00% of the 29,129 total deaths in this group.
This is up 3% compared to Old Normal rates which, when applied to this year's population of 141,652 would have predicted 28,415 deaths from All Causes this year.
This means there were 714 more deaths than expected from All Causes among elderly men and women aged 80+ living in Washington in 2022.
Overall, 210,863 deaths from All Causes represent 8,523 lives lost among elderly men and women aged 80+ over the first 8 years of Washington's New Normal™.
Click the bar graph above to see how the 8 year total of 210,863 excess individual deaths from All Causes is arrived at.
Yearly All Causes Tally: 78,084 / 69,191*
* Washington does not report the deaths of 8,893 babies in it's death totals