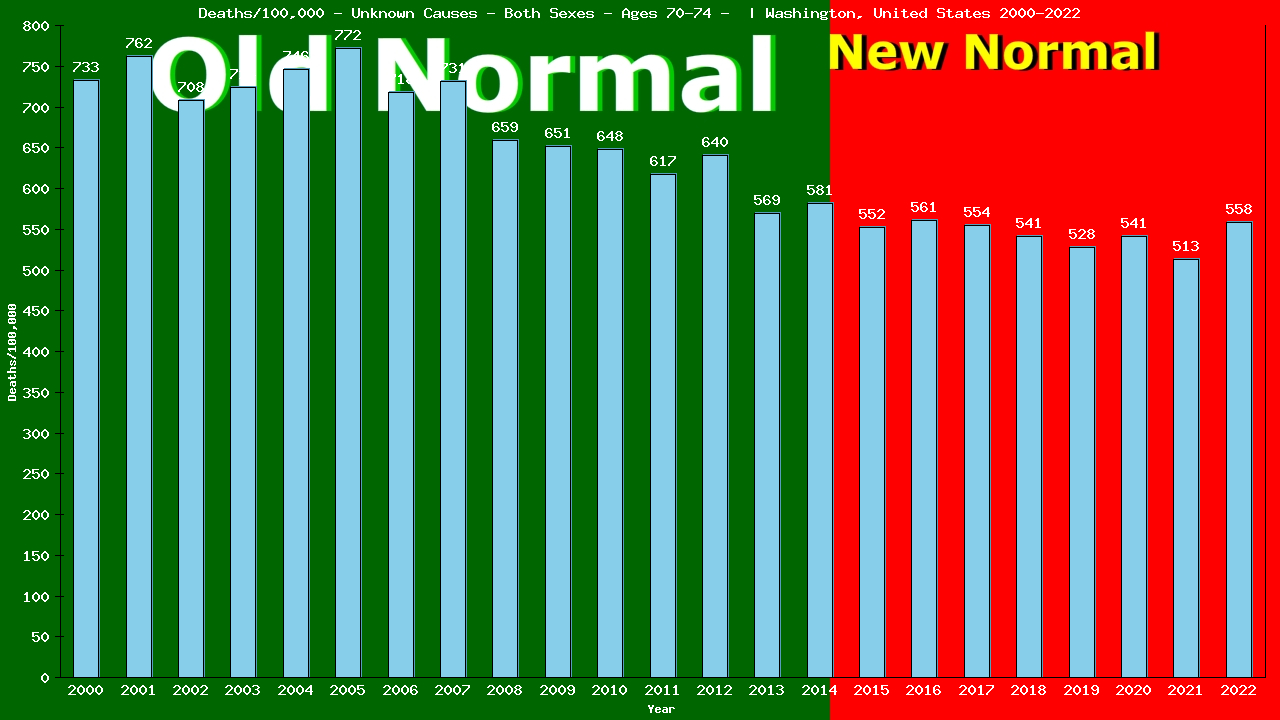
2022 vs New Normal™ for elderly men and women aged 70-74 in Washington
1,973 of 7,650 total deaths were from Unknown Causes
25.79% of all deaths were from Unknown Causes
This is down 17% compared to Old Normal rates.
2,387 of 8,335 total deaths would have been expected under Old Normal conditions.
414 fewer deaths from Unknown Causes in 2022.
685 fewer All Cause deaths in 2022.
3,312 fewer deaths from Unknown Causes (2015-2022)
7,177 fewer All Cause deaths over the first 8 years of Washington’s New Normal™.
To show this year’s deaths from Unknown Causes are down 17% compared to Old Normal rates, we need to calculate the rates for both 2022 and for the Old Normal.
Remember, death rates are calculated to answer these questions:
“How many elderly men and women aged 70-74 were there?” and
“How many of them died from Unknown Causes?”
The following 2 charts provide this information:
Deaths – Unknown Causes – Elderly Men And Women – Aged 70-74 | Washington, United-states
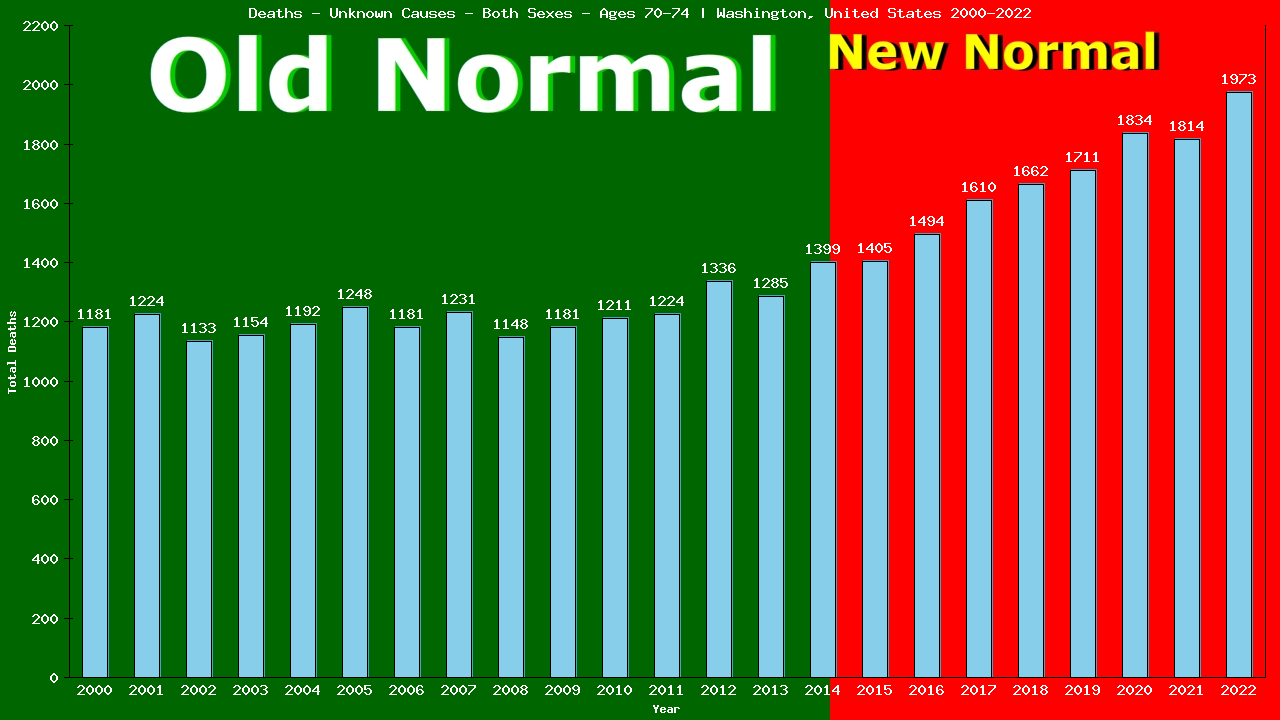
Population – Elderly Men And Women – Aged 70-74 – [2000-2022] | Washington, United-states
From the charts, we can see that in 2022, 1,973 of 352,951 elderly men and women aged 70-74 living in Washington died from Unknown Causes.
1,973 ÷ 352,951 = 0.00559 (2022 CDR)
We’ll use the table below to calculate our Old Normal rate for deaths from Unknown Causes
Old Normal (2001-2014) Washington elderly men and women aged 70-74 Unknown Causes
Year
Pop
Died
From
|2000
160,941
4,450
1,181
|2001
160,478
4,491
1,224
|2002
159,849
4,338
1,133
|2003
159,387
4,216
1,154
|2004
159,585
3,977
1,192
|Year
Pop
Died
From
|2005
161,459
4,032
1,248
|2006
164,448
3,904
1,181
|2007
168,285
4,176
1,231
|2008
174,158
4,133
1,148
|2009
181,228
4,122
1,181
|Year
Pop
Died
From
|2010
186,746
4,106
1,211
|2011
198,113
4,247
1,224
|2012
208,724
4,348
1,336
|2013
225,810
4,543
1,285
|2014
240,532
4,909
1,399
Cumulative:
Population
Deaths
Unknown Causes
Totals:
2,709,743
63,992
18,328
The table shows there were a total of 18,328 deaths from Unknown Causes among 2,709,743 elderly men and women aged 70-74 living in Washington in the 15 years immediately prior to the New Normal™.
18,328 ÷ 2,709,743 = 0.00676 (Old Normal CDR)
We can use the Old Normal rate to predict this year’s deaths:
2022 pop X Old Normal CDR = expected deaths
352,951 X 0.00676 = 2,387 expected deaths
The difference between actual and expected deaths shows lives saved or lost:
1,973 – 2,387 = -414
Dividing the actual deaths by the expected deaths gives us the comparative rates:
1,973 ÷ 2,387 = 0.8252
This reveals 414 lives saved and is 82.52% of what we expected (a decrease of 17%) in deaths from Unknown Causes among elderly men and women aged 70-74 living in Washington in 2022, as compared to the Old Normal.
5yr CDR (2017-2021)
Year
Pop
Died
From
|2017
290,311
5,888
1,610
|2018
307,119
6,009
1,662
|2019
323,559
6,430
1,711
|2020
338,543
6,991
1,834
|2021
353,111
7,924
1,814
Total:
2,133,107
43,883
11,530
This is the same method used by Public Health to calculate the 5-yr CDR (Cumulative Death Rate):
11,530 ÷ 2,133,107 = 0.00541 (5-yr CDR)
352,951(2022 pop) X 0.00541 = 1,908 expected deaths
The difference between actual and expected deaths:
1,973 – 1,908 = 65 or 65 lives lost
Divide actual deaths by expected deaths:
1,973 ÷ 1,908 = 1.0323 or an increase of 3%
for deaths from Unknown Causes among elderly men and women aged 70-74 living in Washington in 2022, as compared to the previous 5 years.
Compare our Old Normal to the 5yr CDR. Does it tell the same story your TV does?
Finally, the same method can also be used to compare our Old Normal rate to the New Normal™ rate:
New Normal™ population X Old Normal rate = expected deaths
2,486,058 X 0.00676 = 16,815 expected deaths
The difference between actual and expected deaths:
13503 – 16,815 = -3,312 or 3,312 lives saved
Dividing the actual deaths by the expected deaths:
13,503 ÷ 16,815 = 0.8018 or a decrease of 20%
in deaths from Unknown Causes among elderly men and women aged 70-74 living in Washington in the New Normal™, as compared to the Old Normal.
New Normal (2015-2022)
Year
Pop
Died
From
|2015
254,370
5,301
1,405
|2016
266,094
5,340
1,494
|2017
290,311
5,888
1,610
|2018
307,119
6,009
1,662
|2019
323,559
6,430
1,711
|2020
338,543
6,991
1,834
|2021
353,111
7,924
1,814
|2022
352,951
7,650
1,973
Total:
2,486,058
51,533
13,503
The world has been led to believe that a deadly pandemic swept the globe beginning in 2020, causing an increase in death rates, especially among the elderly
The data show that death rates began to increase in 2015, immediately upon implementation of the UN’s 2030 Agenda for Sustainable Development, that young adults have experienced ever-increasing death rates since, and that death rates among the elderly have remained relatively stable.
Browse through the age-categorized charts below to see the evidence of this. Click on any chart to see the full analysis for each age group.
Deaths/100,000 elderly men and women 70-74 from Unknown Causes
20,494 of the 69,191 deaths among individuals of all ages living in Washington in 2022 were from Unknown Causes (29.62% of all deaths).
This is up 14% compared to Old Normal (2000-2014) rates which, when applied to the this year's both sexes population of 7,650,667 individuals would have predicted 17,879 deaths from Unknown Causes.
This means there were 2,615 more deaths than expected from Unknown Causes among individuals of all ages living in Washington in 2022.
To date, 11,216 individual lives have been lost to Unknown Causes over the first 8 years of Washington's New Normal™.
Browse through the age categories below to learn how these deaths from Unknown Causes in 2022 are distributed among each age group of individuals in Washington.
Click the bar graph above to see how both the 2022 loss of 2,615 lives and the 8-year loss of 11,216 individual lives from Unknown Causes is arrived at.
The first 328 of the 20,494 deaths from Unknown Causes in 2022 were among babies in their first year of life, accounting for 91.11% of the 360 total deaths in this group.
This is down 13% compared to Old Normal rates which, when applied to this year's population of 84,431 babies in their first year of life, would have predicted 376 deaths from Unknown Causes this year.
This means there were 48 fewer deaths than expected from Unknown Causes among babies in their first year of life living in Washington in 2022.
Overall, 2,690 deaths from Unknown Causes represent 439 lives saved among babies in their first year of life over the first 8 years of Washington's New Normal™.
Click the bar graph above to see how both the 2022 total of 48 fewer live lost than expected and the 8 year total of 2690 lives saved from Unknown Causes among babies in their first year of life is arrived at.
Yearly Unknown Causes Tally: 328 / 20,494
The next 88 of the 20,494 individual deaths from Unknown Causes in 2022 were among pre-schoolers aged 1-4, accounting for 99.99% of the 88 total deaths in this group.
This is up 10% compared to Old Normal rates. Those rates, applied to this year's population of 341,398 pre-schoolers aged 1-4, would have predicted 76 deaths from Unknown Causes this year.
This means there were 12 more deaths than expected from Unknown Causes among pre-schoolers aged 1-4 living in Washington in 2022.
Overall, 552 deaths from Unknown Causes represent 94 lives saved among pre-schoolers aged 1-4 over the first 8 years of Washington's New Normal™.
Click the bar graph above to see how the both the 2022 total of 12 more and the 8 year total of 552 more individual aged 1-4 deaths from Unknown Causes is arrived at.
Yearly Unknown Causes Tally: 416 / 20,494
The next 49 of the 20,494 individual deaths from Unknown Causes in 2022 were among children aged 5-9, accounting for 99.98% of the 49 total deaths in this group.
This is down 14% compared to Old Normal rates. Those rates, applied to this year's population of 462,468 children aged 5-9, would have predicted 53 deaths from Unknown Causes this year.
This means there were 4 fewer deaths than expected from Unknown Causes among children aged 5-9 living in Washington in 2022.
Overall, 338 deaths from Unknown Causes represent 85 lives saved among children aged 5-9 over the first 8 years of Washington's New Normal™.
Click the bar graph above to see how the both the 2022 total of 4 fewer and the 8 year total of 338 fewer individual aged 5-9 deaths from Unknown Causes is arrived at.
Yearly Unknown Causes Tally: 465 / 20,494
The next 69 of the 20,494 individual deaths from Unknown Causes in 2022 were among children aged 10-14, accounting for 99.99% of the 69 total deaths in this group.
This is up 1% compared to Old Normal rates. Those rates, applied to this year's population of 473,078 children aged 10-14, would have predicted 65 deaths from Unknown Causes this year.
This means there were 4 more deaths than expected from Unknown Causes among children aged 10-14 living in Washington in 2022.
Overall, 507 deaths from Unknown Causes represent 1 lives saved among children aged 10-14 over the first 8 years of Washington's New Normal™.
Click the bar graph above to see how the both the 2022 total of 4 more and the 8 year total of 507 more individual aged 10-14 deaths from Unknown Causes is arrived at.
Yearly Unknown Causes Tally: 534 / 20,494
The next 157 of the 20,494 individual deaths from Unknown Causes in 2022 were among teens aged 15-19, accounting for 65.41% of the 240 total deaths in this group.
This is down 22% compared to Old Normal rates. Those rates, applied to this year's population of 459,601 teens aged 15-19, would have predicted 198 deaths from Unknown Causes this year.
This means there were 41 fewer deaths than expected from Unknown Causes among teens aged 15-19 living in Washington in 2022.
Overall, 1,212 deaths from Unknown Causes represent 332 lives saved among teens aged 15-19 over the first 8 years of Washington's New Normal™.
Click the bar graph above to see how the both the 2022 total of 41 fewer and the 8 year total of 1,212 fewer individual aged 15-19 deaths from Unknown Causes is arrived at.
Yearly Unknown Causes Tally: 691 / 20,494
The next 241 of the 20,494 individual deaths from Unknown Causes in 2022 were among people aged 20-24, accounting for 50.31% of the 479 total deaths in this group.
This is down 16% compared to Old Normal rates. Those rates, applied to this year's population of 502,795 people aged 20-24, would have predicted 282 deaths from Unknown Causes this year.
This means there were 41 fewer deaths than expected from Unknown Causes among people aged 20-24 living in Washington in 2022.
Overall, 1,917 deaths from Unknown Causes represent 260 lives saved among people aged 20-24 over the first 8 years of Washington's New Normal™.
Click the bar graph above to see how the both the 2022 total of 41 fewer and the 8 year total of 1,917 fewer individual aged 20-24 deaths from Unknown Causes is arrived at.
Yearly Unknown Causes Tally: 932 / 20,494
The next 349 of the 20,494 individual deaths from Unknown Causes in 2022 were among people aged 25-29, accounting for 52.80% of the 661 total deaths in this group.
This is up 8% compared to Old Normal rates. Those rates, applied to this year's population of 561,023 people aged 25-29, would have predicted 318 deaths from Unknown Causes this year.
This means there were 31 more deaths than expected from Unknown Causes among people aged 25-29 living in Washington in 2022.
Overall, 2,601 deaths from Unknown Causes represent 16 lives lost among people aged 25-29 over the first 8 years of Washington's New Normal™.
Click the bar graph above to see how the both the 2022 total of 31 more and the 8 year total of 2,601 more individual aged 25-29 deaths from Unknown Causes is arrived at.
Yearly Unknown Causes Tally: 1,281 / 20,494
The next 531 of the 20,494 individual deaths from Unknown Causes in 2022 were among people aged 30-34, accounting for 53.21% of the 998 total deaths in this group.
This is up 20% compared to Old Normal rates. Those rates, applied to this year's population of 620,582 people aged 30-34, would have predicted 435 deaths from Unknown Causes this year.
This means there were 96 more deaths than expected from Unknown Causes among people aged 30-34 living in Washington in 2022.
Overall, 3,364 deaths from Unknown Causes represent 160 lives lost among people aged 30-34 over the first 8 years of Washington's New Normal™.
Click the bar graph above to see how the both the 2022 total of 96 more and the 8 year total of 3,364 more individual aged 30-34 deaths from Unknown Causes is arrived at.
Yearly Unknown Causes Tally: 1,812 / 20,494
The next 576 of the 20,494 individual deaths from Unknown Causes in 2022 were among people aged 35-39, accounting for 54.13% of the 1,064 total deaths in this group.
This is up 6% compared to Old Normal rates. Those rates, applied to this year's population of 579,368 people aged 35-39, would have predicted 536 deaths from Unknown Causes this year.
This means there were 40 more deaths than expected from Unknown Causes among people aged 35-39 living in Washington in 2022.
Overall, 4,015 deaths from Unknown Causes represent 41 lives lost among people aged 35-39 over the first 8 years of Washington's New Normal™.
Click the bar graph above to see how the both the 2022 total of 40 more and the 8 year total of 4,015 more individual aged 35-39 deaths from Unknown Causes is arrived at.
Yearly Unknown Causes Tally: 2,388 / 20,494
The next 744 of the 20,494 individual deaths from Unknown Causes in 2022 were among people aged 40-44, accounting for 59.00% of the 1,261 total deaths in this group.
This is up 10% compared to Old Normal rates. Those rates, applied to this year's population of 530,134 people aged 40-44, would have predicted 672 deaths from Unknown Causes this year.
This means there were 72 more deaths than expected from Unknown Causes among people aged 40-44 living in Washington in 2022.
Overall, 4,983 deaths from Unknown Causes represent 107 lives lost among people aged 40-44 over the first 8 years of Washington's New Normal™.
Click the bar graph above to see how the both the 2022 total of 72 more and the 8 year total of 4,983 more individual aged 40-44 deaths from Unknown Causes is arrived at.
Yearly Unknown Causes Tally: 3,132 / 20,494
The next 860 of the 20,494 individual deaths from Unknown Causes in 2022 were among people aged 45-49, accounting for 61.38% of the 1,401 total deaths in this group.
This is up 12% compared to Old Normal rates. Those rates, applied to this year's population of 456,932 people aged 45-49, would have predicted 765 deaths from Unknown Causes this year.
This means there were 95 more deaths than expected from Unknown Causes among people aged 45-49 living in Washington in 2022.
Overall, 6,595 deaths from Unknown Causes represent 360 lives lost among people aged 45-49 over the first 8 years of Washington's New Normal™.
Click the bar graph above to see how the both the 2022 total of 95 more and the 8 year total of 6,595 more individual aged 45-49 deaths from Unknown Causes is arrived at.
Yearly Unknown Causes Tally: 3,992 / 20,494
The next 1,162 of the 20,494 individual deaths from Unknown Causes in 2022 were among people aged 50-54, accounting for 51.05% of the 2,276 total deaths in this group.
This is up 18% compared to Old Normal rates. Those rates, applied to this year's population of 473,351 people aged 50-54, would have predicted 982 deaths from Unknown Causes this year.
This means there were 180 more deaths than expected from Unknown Causes among people aged 50-54 living in Washington in 2022.
Overall, 8,815 deaths from Unknown Causes represent 1,024 lives lost among people aged 50-54 over the first 8 years of Washington's New Normal™.
Click the bar graph above to see how the both the 2022 total of 180 more and the 8 year total of 8,815 more individual aged 50-54 deaths from Unknown Causes is arrived at.
Yearly Unknown Causes Tally: 5,154 / 20,494
The next 1,405 of the 20,494 individual deaths from Unknown Causes in 2022 were among people aged 55-59, accounting for 43.39% of the 3,238 total deaths in this group.
This is up 17% compared to Old Normal rates. Those rates, applied to this year's population of 459,024 people aged 55-59, would have predicted 1,197 deaths from Unknown Causes this year.
This means there were 208 more deaths than expected from Unknown Causes among people aged 55-59 living in Washington in 2022.
Overall, 11,017 deaths from Unknown Causes represent 937 lives lost among people aged 55-59 over the first 8 years of Washington's New Normal™.
Click the bar graph above to see how the both the 2022 total of 208 more and the 8 year total of 11,017 more individual aged 55-59 deaths from Unknown Causes is arrived at.
Yearly Unknown Causes Tally: 6,559 / 20,494
The next 1,681 of the 20,494 individual deaths from Unknown Causes in 2022 were among people aged 60-64, accounting for 33.31% of the 5,046 total deaths in this group.
This is up 2% compared to Old Normal rates. Those rates, applied to this year's population of 473,041 people aged 60-64, would have predicted 1,650 deaths from Unknown Causes this year.
This means there were 31 more deaths than expected from Unknown Causes among people aged 60-64 living in Washington in 2022.
Overall, 12,764 deaths from Unknown Causes represent 239 lives saved among people aged 60-64 over the first 8 years of Washington's New Normal™.
Click the bar graph above to see how the both the 2022 total of 31 more and the 8 year total of 12,764 more individual aged 60-64 deaths from Unknown Causes is arrived at.
Yearly Unknown Causes Tally: 8,240 / 20,494
The next 1,864 of the 20,494 individual deaths from Unknown Causes in 2022 were among elderly men and women aged 65-69, accounting for 29.26% of the 6,370 total deaths in this group.
This is down 10% compared to Old Normal rates. Those rates, applied to this year's population of 431,631 elderly men and women aged 65-69, would have predicted 2,067 deaths from Unknown Causes this year.
This means there were 203 fewer deaths than expected from Unknown Causes among elderly men and women aged 65-69 living in Washington in 2022.
Overall, 13,714 deaths from Unknown Causes represent 1,830 lives saved among elderly men and women aged 65-69 over the first 8 years of Washington's New Normal™.
Click the bar graph above to see how the both the 2022 total of 203 fewer and the 8 year total of 13,714 fewer individual aged 65-69 deaths from Unknown Causes is arrived at.
Yearly Unknown Causes Tally: 10,104 / 20,494
The next 1,973 of the 20,494 individual deaths from Unknown Causes in 2022 were among elderly men and women aged 70-74, accounting for 25.79% of the 7,650 total deaths in this group.
This is down 17% compared to Old Normal rates. Those rates, applied to this year's population of 352,951 elderly men and women aged 70-74, would have predicted 2,387 deaths from Unknown Causes this year.
This means there were 414 fewer deaths than expected from Unknown Causes among elderly men and women aged 70-74 living in Washington in 2022.
Overall, 13,503 deaths from Unknown Causes represent 3,312 lives saved among elderly men and women aged 70-74 over the first 8 years of Washington's New Normal™.
Click the bar graph above to see how the both the 2022 total of 414 fewer and the 8 year total of 13,503 fewer individual aged 70-74 deaths from Unknown Causes is arrived at.
Yearly Unknown Causes Tally: 12,077 / 20,494
The next 1,954 of the 20,494 individual deaths from Unknown Causes in 2022 were among elderly men and women aged 75-79, accounting for 22.17% of the 8,812 total deaths in this group.
This is down 12% compared to Old Normal rates. Those rates, applied to this year's population of 247,207 elderly men and women aged 75-79, would have predicted 2,216 deaths from Unknown Causes this year.
This means there were 262 fewer deaths than expected from Unknown Causes among elderly men and women aged 75-79 living in Washington in 2022.
Overall, 13,411 deaths from Unknown Causes represent 1,144 lives saved among elderly men and women aged 75-79 over the first 8 years of Washington's New Normal™.
Click the bar graph above to see how the both the 2022 total of 262 fewer and the 8 year total of 13,411 fewer individual aged 75-79 deaths from Unknown Causes is arrived at.
Yearly Unknown Causes Tally: 14,031 / 20,494
The next 1,896 of the 20,494 individual deaths from Unknown Causes in 2022 were among elderly men and women aged 80-84, accounting for 21.32% of the 8,893 total deaths in this group.
This is up 7% compared to Old Normal rates. Those rates, applied to this year's population of 141,652 elderly men and women aged 80-84, would have predicted 1,778 deaths from Unknown Causes this year.
This means there were 118 more deaths than expected from Unknown Causes among elderly men and women aged 80-84 living in Washington in 2022.
Overall, 13,292 deaths from Unknown Causes represent 633 lives lost among elderly men and women aged 80-84 over the first 8 years of Washington's New Normal™.
Click the bar graph above to see how the both the 2022 total of 118 more and the 8 year total of 13,292 more individual aged 80-84 deaths from Unknown Causes is arrived at.
Yearly Unknown Causes Tally: 15,927 / 20,494
The next 6,463 of the 20,494 deaths from Unknown Causes in 2022 were among elderly men and women aged 80+, accounting for 22.19% of the 29,129 total deaths in this group.
This is up 8% compared to Old Normal rates which, when applied to this year's population of 141,652 would have predicted 5,991 deaths from Unknown Causes this year.
This means there were 472 more deaths than expected from Unknown Causes among elderly men and women aged 80+ living in Washington in 2022.
Overall, 47,514 deaths from Unknown Causes represent 4,850 lives lost among elderly men and women aged 80+ over the first 8 years of Washington's New Normal™.
Click the bar graph above to see how the 8 year total of 47,514 excess individual deaths from Unknown Causes is arrived at.
Yearly Unknown Causes Tally: 22,390 / 20,494*
* Washington does not report the deaths of 1,896 babies in it's death totals