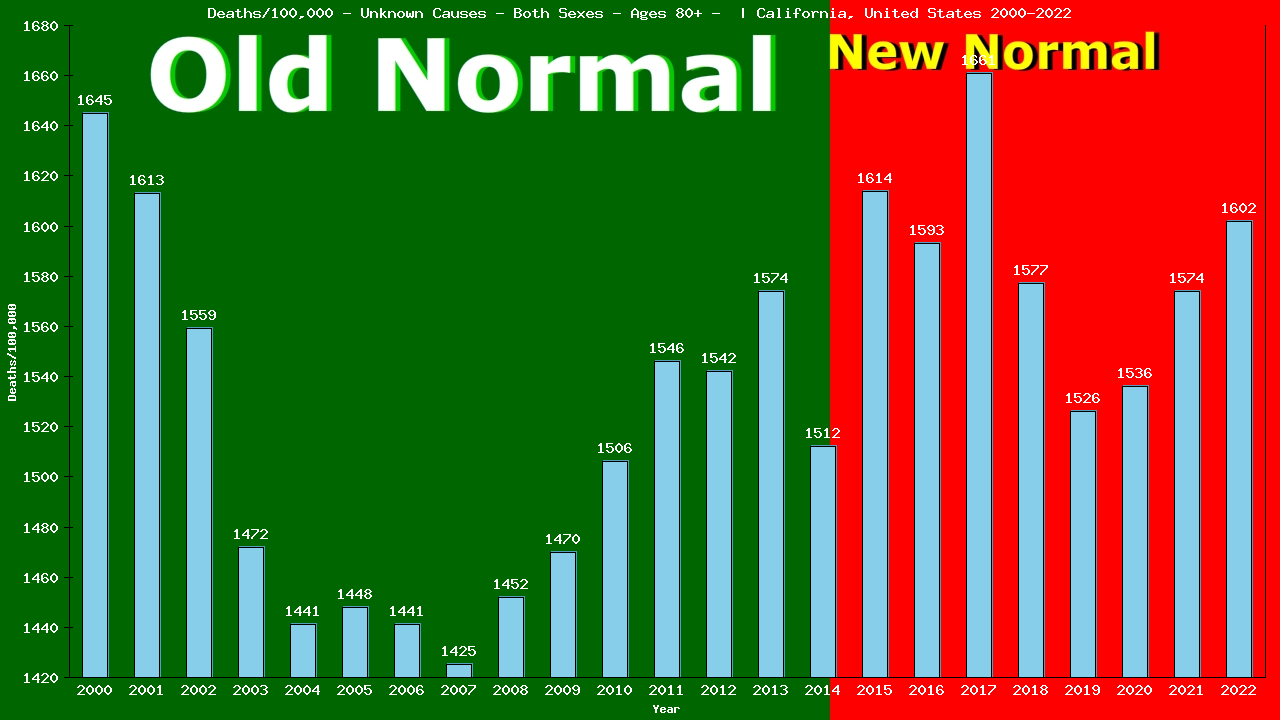
2022 vs New Normal™ for elderly men and women aged 80+ in California
- 11,449 of 138,098 total deaths were from Unknown Causes
- 8.29% of all deaths were from Unknown Causes
- This is up 6% compared to Old Normal rates.
- 10,775 of 129,396 total deaths would have been expected under Old Normal conditions.
- 674 more deaths from Unknown Causes in 2022.
- 8,702 more All Cause deaths in 2022.
- 4,110 more deaths from Unknown Causes (2015-2022)
- 59,343 more All Cause deaths over the first 8 years of California’s New Normal™.
- To show this year’s deaths from Unknown Causes are up 6% compared to Old Normal rates, we need to calculate the rates for both 2022 and for the Old Normal.
Remember, death rates are calculated to answer these questions:
- “How many elderly men and women aged 80+ were there?” and
- “How many of them died from Unknown Causes?”
The following 2 charts provide this information:
Deaths – Unknown Causes – Elderly Men And Women – Aged 80+ | California, United-states
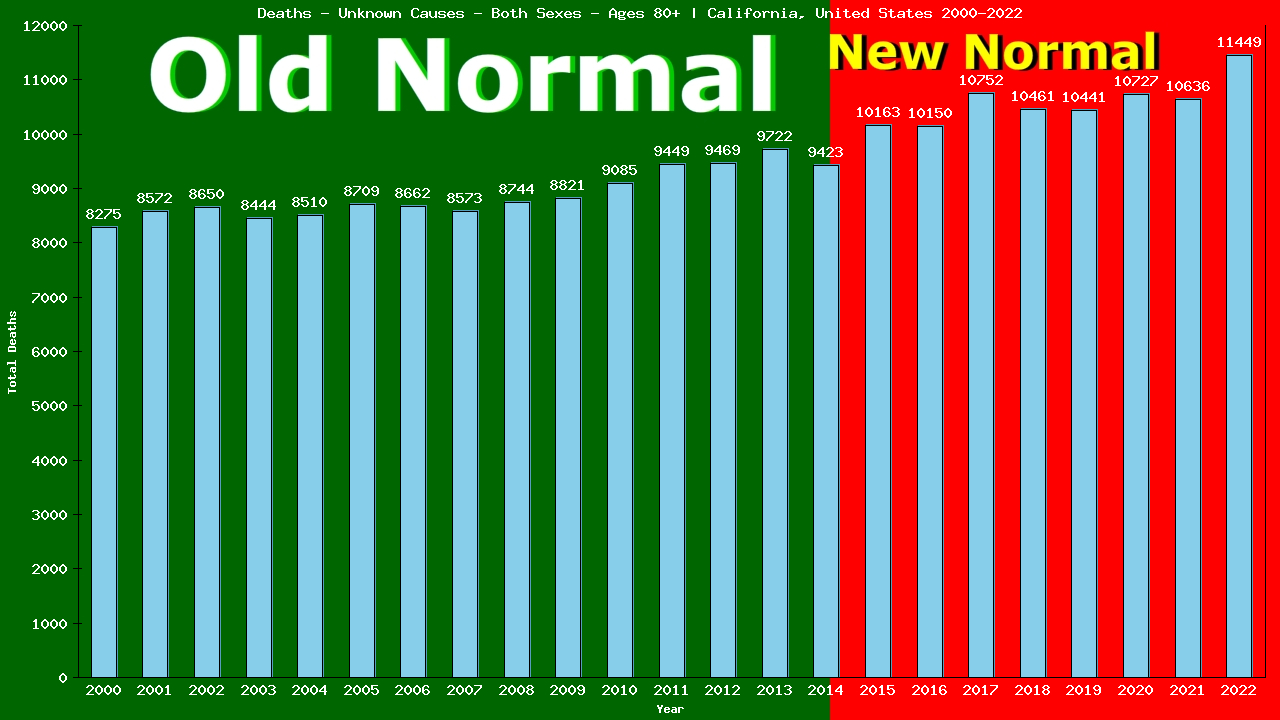
Population – Elderly Men And Women – Aged 80+ – [2000-2022] | California, United-states
From the charts, we can see that in 2022, 11,449 of 714,480 elderly men and women aged 80+ living in California died from Unknown Causes.
11,449 ÷ 714,480 = 0.01602 (2022 CDR)
We’ll use the table below to calculate our Old Normal rate for deaths from Unknown Causes
|2000
502,831
96,540
8,275
|2001
531,112
99,325
8,572
|2002
554,814
100,882
8,650
|2003
573,411
104,525
8,444
|2004
590,328
101,631
8,510
|2005
601,355
105,138
8,709
|2006
600,752
106,546
8,662
|2007
601,524
104,776
8,573
|2008
602,079
107,256
8,744
|2009
599,827
105,874
8,821
|2010
603,239
109,430
9,085
|2011
610,882
112,976
9,449
|2012
613,808
113,627
9,469
|2013
617,438
116,599
9,722
|2014
623,036
113,386
9,423
Cumulative:
Population
Deaths
Unknown Causes
The table shows there were a total of 133,108 deaths from Unknown Causes among 8,826,436 elderly men and women aged 80+ living in California in the 15 years immediately prior to the New Normal™.
133,108 ÷ 8,826,436 = 0.01508 (Old Normal CDR)
We can use the Old Normal rate to predict this year’s deaths:
2022 pop X Old Normal CDR = expected deaths
714,480 X 0.01508 = 10,775 expected deaths
The difference between actual and expected deaths shows lives saved or lost:
11,449 – 10,775 = 674
Dividing the actual deaths by the expected deaths gives us the comparative rates:
11,449 ÷ 10,775 = 1.0619
This reveals 674 lives lost and is 106.19% of what we expected (an increase of 6%) in deaths from Unknown Causes among elderly men and women aged 80+ living in California in 2022, as compared to the Old Normal.
|2017
647,135
124,163
10,752
|2018
663,308
123,340
10,461
|2019
683,918
123,293
10,441
|2020
698,039
140,343
10,727
|2021
675,577
138,003
10,636
This is the same method used by Public Health to calculate the 5-yr CDR (Cumulative Death Rate):
73,330 ÷ 4,634,678 = 0.01582 (5-yr CDR)
714,480(2022 pop) X 0.01582 = 11,305 expected deaths
The difference between actual and expected deaths:
11,449 – 11,305 = 144 or 144 lives lost
Divide actual deaths by expected deaths:
11,449 ÷ 11,305 = 1.0121 or an increase of 1%
for deaths from Unknown Causes among elderly men and women aged 80+ living in California in 2022, as compared to the previous 5 years.
Compare our Old Normal to the 5yr CDR. Does it tell the same story your TV does?
Finally, the same method can also be used to compare our Old Normal rate to the New Normal™ rate:
New Normal™ population X Old Normal rate = expected deaths
5,349,158 X 0.01508 = 80,669 expected deaths
The difference between actual and expected deaths:
84779 – 80,669 = 4,110 or 4,110 lives lost
Dividing the actual deaths by the expected deaths:
84,779 ÷ 80,669 = 1.0503 or an increase of 5%
in deaths from Unknown Causes among elderly men and women aged 80+ living in California in the New Normal™, as compared to the Old Normal.
|2015
629,663
120,377
10,163
|2016
637,038
120,485
10,150
|2017
647,135
124,163
10,752
|2018
663,308
123,340
10,461
|2019
683,918
123,293
10,441
|2020
698,039
140,343
10,727
|2021
675,577
138,003
10,636
|2022
714,480
138,098
11,449
The world has been led to believe that a deadly pandemic swept the globe beginning in 2020, causing an increase in death rates, especially among the elderly
The data show that death rates began to increase in 2015, immediately upon implementation of the UN’s 2030 Agenda for Sustainable Development, that young adults have experienced ever-increasing death rates since, and that death rates among the elderly have remained relatively stable.
Browse through the age-categorized charts below to see the evidence of this. Click on any chart to see the full analysis for each age group.
Deaths/100,000 elderly men and women 80+ from Unknown Causes
40,867 of the 313,148 deaths among individuals of all ages living in California in 2022 were from Unknown Causes (13.05% of all deaths).
This is up 8% compared to Old Normal (2000-2014) rates which, when applied to the this year's both sexes population of 38,289,915 individuals would have predicted 37,501 deaths from Unknown Causes.
This means there were 3,366 more deaths than expected from Unknown Causes among individuals of all ages living in California in 2022.
To date, 4,497 individual lives have been lost to Unknown Causes over the first 8 years of California's New Normal™.
Browse through the age categories below to learn how these deaths from Unknown Causes in 2022 are distributed among each age group of individuals in California.
Click the bar graph above to see how both the 2022 loss of 3,366 lives and the 8-year loss of 4,497 individual lives from Unknown Causes is arrived at.
The first 916 of the 40,867 deaths from Unknown Causes in 2022 were among babies in their first year of life, accounting for 53.98% of the 1,697 total deaths in this group.
This is down 12% compared to Old Normal rates which, when applied to this year's population of 425,149 babies in their first year of life, would have predicted 1,035 deaths from Unknown Causes this year.
This means there were 119 fewer deaths than expected from Unknown Causes among babies in their first year of life living in California in 2022.
Overall, 7,848 deaths from Unknown Causes represent 1,220 lives saved among babies in their first year of life over the first 8 years of California's New Normal™.
Click the bar graph above to see how both the 2022 total of 119 fewer live lost than expected and the 8 year total of 7848 lives saved from Unknown Causes among babies in their first year of life is arrived at.
Yearly Unknown Causes Tally: 916 / 40,867
The next 321 of the 40,867 individual deaths from Unknown Causes in 2022 were among pre-schoolers aged 1-4, accounting for 95.53% of the 336 total deaths in this group.
This is down 18% compared to Old Normal rates. Those rates, applied to this year's population of 1,702,615 pre-schoolers aged 1-4, would have predicted 377 deaths from Unknown Causes this year.
This means there were 56 fewer deaths than expected from Unknown Causes among pre-schoolers aged 1-4 living in California in 2022.
Overall, 2,489 deaths from Unknown Causes represent 879 lives saved among pre-schoolers aged 1-4 over the first 8 years of California's New Normal™.
Click the bar graph above to see how the both the 2022 total of 56 fewer and the 8 year total of 2,489 fewer individual aged 1-4 deaths from Unknown Causes is arrived at.
Yearly Unknown Causes Tally: 1,237 / 40,867
The next 226 of the 40,867 individual deaths from Unknown Causes in 2022 were among children aged 5-9, accounting for 100.00% of the 226 total deaths in this group.
This is down 21% compared to Old Normal rates. Those rates, applied to this year's population of 2,358,168 children aged 5-9, would have predicted 262 deaths from Unknown Causes this year.
This means there were 36 fewer deaths than expected from Unknown Causes among children aged 5-9 living in California in 2022.
Overall, 1,761 deaths from Unknown Causes represent 445 lives saved among children aged 5-9 over the first 8 years of California's New Normal™.
Click the bar graph above to see how the both the 2022 total of 36 fewer and the 8 year total of 1,761 fewer individual aged 5-9 deaths from Unknown Causes is arrived at.
Yearly Unknown Causes Tally: 1,463 / 40,867
The next 286 of the 40,867 individual deaths from Unknown Causes in 2022 were among children aged 10-14, accounting for 91.66% of the 312 total deaths in this group.
This is down 17% compared to Old Normal rates. Those rates, applied to this year's population of 2,476,125 children aged 10-14, would have predicted 318 deaths from Unknown Causes this year.
This means there were 32 fewer deaths than expected from Unknown Causes among children aged 10-14 living in California in 2022.
Overall, 2,165 deaths from Unknown Causes represent 432 lives saved among children aged 10-14 over the first 8 years of California's New Normal™.
Click the bar graph above to see how the both the 2022 total of 32 fewer and the 8 year total of 2,165 fewer individual aged 10-14 deaths from Unknown Causes is arrived at.
Yearly Unknown Causes Tally: 1,749 / 40,867
The next 486 of the 40,867 individual deaths from Unknown Causes in 2022 were among teens aged 15-19, accounting for 42.97% of the 1,131 total deaths in this group.
This is down 22% compared to Old Normal rates. Those rates, applied to this year's population of 2,564,615 teens aged 15-19, would have predicted 596 deaths from Unknown Causes this year.
This means there were 110 fewer deaths than expected from Unknown Causes among teens aged 15-19 living in California in 2022.
Overall, 4,041 deaths from Unknown Causes represent 719 lives saved among teens aged 15-19 over the first 8 years of California's New Normal™.
Click the bar graph above to see how the both the 2022 total of 110 fewer and the 8 year total of 4,041 fewer individual aged 15-19 deaths from Unknown Causes is arrived at.
Yearly Unknown Causes Tally: 2,235 / 40,867
The next 784 of the 40,867 individual deaths from Unknown Causes in 2022 were among people aged 20-24, accounting for 35.11% of the 2,233 total deaths in this group.
This is down 12% compared to Old Normal rates. Those rates, applied to this year's population of 2,651,334 people aged 20-24, would have predicted 860 deaths from Unknown Causes this year.
This means there were 76 fewer deaths than expected from Unknown Causes among people aged 20-24 living in California in 2022.
Overall, 6,353 deaths from Unknown Causes represent 655 lives saved among people aged 20-24 over the first 8 years of California's New Normal™.
Click the bar graph above to see how the both the 2022 total of 76 fewer and the 8 year total of 6,353 fewer individual aged 20-24 deaths from Unknown Causes is arrived at.
Yearly Unknown Causes Tally: 3,019 / 40,867
The next 1,091 of the 40,867 individual deaths from Unknown Causes in 2022 were among people aged 25-29, accounting for 32.10% of the 3,399 total deaths in this group.
This is up 1% compared to Old Normal rates. Those rates, applied to this year's population of 2,757,767 people aged 25-29, would have predicted 1,079 deaths from Unknown Causes this year.
This means there were 12 more deaths than expected from Unknown Causes among people aged 25-29 living in California in 2022.
Overall, 8,817 deaths from Unknown Causes represent 584 lives saved among people aged 25-29 over the first 8 years of California's New Normal™.
Click the bar graph above to see how the both the 2022 total of 12 more and the 8 year total of 8,817 more individual aged 25-29 deaths from Unknown Causes is arrived at.
Yearly Unknown Causes Tally: 4,110 / 40,867
The next 1,446 of the 40,867 individual deaths from Unknown Causes in 2022 were among people aged 30-34, accounting for 31.65% of the 4,568 total deaths in this group.
This is up 0% compared to Old Normal rates. Those rates, applied to this year's population of 2,989,584 people aged 30-34, would have predicted 1,413 deaths from Unknown Causes this year.
This means there were 33 more deaths than expected from Unknown Causes among people aged 30-34 living in California in 2022.
Overall, 10,770 deaths from Unknown Causes represent 315 lives saved among people aged 30-34 over the first 8 years of California's New Normal™.
Click the bar graph above to see how the both the 2022 total of 33 more and the 8 year total of 10,770 more individual aged 30-34 deaths from Unknown Causes is arrived at.
Yearly Unknown Causes Tally: 5,556 / 40,867
The next 1,619 of the 40,867 individual deaths from Unknown Causes in 2022 were among people aged 35-39, accounting for 32.93% of the 4,916 total deaths in this group.
This is up 1% compared to Old Normal rates. Those rates, applied to this year's population of 2,783,889 people aged 35-39, would have predicted 1,571 deaths from Unknown Causes this year.
This means there were 48 more deaths than expected from Unknown Causes among people aged 35-39 living in California in 2022.
Overall, 12,162 deaths from Unknown Causes represent 199 lives saved among people aged 35-39 over the first 8 years of California's New Normal™.
Click the bar graph above to see how the both the 2022 total of 48 more and the 8 year total of 12,162 more individual aged 35-39 deaths from Unknown Causes is arrived at.
Yearly Unknown Causes Tally: 7,175 / 40,867
The next 1,675 of the 40,867 individual deaths from Unknown Causes in 2022 were among people aged 40-44, accounting for 28.60% of the 5,856 total deaths in this group.
This is down 6% compared to Old Normal rates. Those rates, applied to this year's population of 2,606,759 people aged 40-44, would have predicted 1,765 deaths from Unknown Causes this year.
This means there were 90 fewer deaths than expected from Unknown Causes among people aged 40-44 living in California in 2022.
Overall, 13,249 deaths from Unknown Causes represent 506 lives saved among people aged 40-44 over the first 8 years of California's New Normal™.
Click the bar graph above to see how the both the 2022 total of 90 fewer and the 8 year total of 13,249 fewer individual aged 40-44 deaths from Unknown Causes is arrived at.
Yearly Unknown Causes Tally: 8,850 / 40,867
The next 1,943 of the 40,867 individual deaths from Unknown Causes in 2022 were among people aged 45-49, accounting for 27.08% of the 7,176 total deaths in this group.
This is down 3% compared to Old Normal rates. Those rates, applied to this year's population of 2,398,337 people aged 45-49, would have predicted 1,969 deaths from Unknown Causes this year.
This means there were 26 fewer deaths than expected from Unknown Causes among people aged 45-49 living in California in 2022.
Overall, 15,277 deaths from Unknown Causes represent 1,292 lives saved among people aged 45-49 over the first 8 years of California's New Normal™.
Click the bar graph above to see how the both the 2022 total of 26 fewer and the 8 year total of 15,277 fewer individual aged 45-49 deaths from Unknown Causes is arrived at.
Yearly Unknown Causes Tally: 10,793 / 40,867
The next 2,377 of the 40,867 individual deaths from Unknown Causes in 2022 were among people aged 50-54, accounting for 22.78% of the 10,435 total deaths in this group.
This is down 2% compared to Old Normal rates. Those rates, applied to this year's population of 2,471,944 people aged 50-54, would have predicted 2,403 deaths from Unknown Causes this year.
This means there were 26 fewer deaths than expected from Unknown Causes among people aged 50-54 living in California in 2022.
Overall, 18,040 deaths from Unknown Causes represent 1,583 lives saved among people aged 50-54 over the first 8 years of California's New Normal™.
Click the bar graph above to see how the both the 2022 total of 26 fewer and the 8 year total of 18,040 fewer individual aged 50-54 deaths from Unknown Causes is arrived at.
Yearly Unknown Causes Tally: 13,170 / 40,867
The next 2,763 of the 40,867 individual deaths from Unknown Causes in 2022 were among people aged 55-59, accounting for 18.13% of the 15,243 total deaths in this group.
This is down 4% compared to Old Normal rates. Those rates, applied to this year's population of 2,385,680 people aged 55-59, would have predicted 2,869 deaths from Unknown Causes this year.
This means there were 106 fewer deaths than expected from Unknown Causes among people aged 55-59 living in California in 2022.
Overall, 21,497 deaths from Unknown Causes represent 2,410 lives saved among people aged 55-59 over the first 8 years of California's New Normal™.
Click the bar graph above to see how the both the 2022 total of 106 fewer and the 8 year total of 21,497 fewer individual aged 55-59 deaths from Unknown Causes is arrived at.
Yearly Unknown Causes Tally: 15,933 / 40,867
The next 3,163 of the 40,867 individual deaths from Unknown Causes in 2022 were among people aged 60-64, accounting for 14.19% of the 22,285 total deaths in this group.
This is down 10% compared to Old Normal rates. Those rates, applied to this year's population of 2,301,629 people aged 60-64, would have predicted 3,492 deaths from Unknown Causes this year.
This means there were 329 fewer deaths than expected from Unknown Causes among people aged 60-64 living in California in 2022.
Overall, 23,663 deaths from Unknown Causes represent 3,639 lives saved among people aged 60-64 over the first 8 years of California's New Normal™.
Click the bar graph above to see how the both the 2022 total of 329 fewer and the 8 year total of 23,663 fewer individual aged 60-64 deaths from Unknown Causes is arrived at.
Yearly Unknown Causes Tally: 19,096 / 40,867
The next 3,368 of the 40,867 individual deaths from Unknown Causes in 2022 were among elderly men and women aged 65-69, accounting for 12.38% of the 27,203 total deaths in this group.
This is down 13% compared to Old Normal rates. Those rates, applied to this year's population of 1,974,129 elderly men and women aged 65-69, would have predicted 3,850 deaths from Unknown Causes this year.
This means there were 482 fewer deaths than expected from Unknown Causes among elderly men and women aged 65-69 living in California in 2022.
Overall, 24,667 deaths from Unknown Causes represent 4,577 lives saved among elderly men and women aged 65-69 over the first 8 years of California's New Normal™.
Click the bar graph above to see how the both the 2022 total of 482 fewer and the 8 year total of 24,667 fewer individual aged 65-69 deaths from Unknown Causes is arrived at.
Yearly Unknown Causes Tally: 22,464 / 40,867
The next 3,406 of the 40,867 individual deaths from Unknown Causes in 2022 were among elderly men and women aged 70-74, accounting for 10.67% of the 31,933 total deaths in this group.
This is down 17% compared to Old Normal rates. Those rates, applied to this year's population of 1,586,759 elderly men and women aged 70-74, would have predicted 4,106 deaths from Unknown Causes this year.
This means there were 700 fewer deaths than expected from Unknown Causes among elderly men and women aged 70-74 living in California in 2022.
Overall, 24,726 deaths from Unknown Causes represent 5,107 lives saved among elderly men and women aged 70-74 over the first 8 years of California's New Normal™.
Click the bar graph above to see how the both the 2022 total of 700 fewer and the 8 year total of 24,726 fewer individual aged 70-74 deaths from Unknown Causes is arrived at.
Yearly Unknown Causes Tally: 25,870 / 40,867
The next 3,548 of the 40,867 individual deaths from Unknown Causes in 2022 were among elderly men and women aged 75-79, accounting for 9.83% of the 36,101 total deaths in this group.
This is down 9% compared to Old Normal rates. Those rates, applied to this year's population of 1,140,952 elderly men and women aged 75-79, would have predicted 3,905 deaths from Unknown Causes this year.
This means there were 357 fewer deaths than expected from Unknown Causes among elderly men and women aged 75-79 living in California in 2022.
Overall, 24,637 deaths from Unknown Causes represent 2,522 lives saved among elderly men and women aged 75-79 over the first 8 years of California's New Normal™.
Click the bar graph above to see how the both the 2022 total of 357 fewer and the 8 year total of 24,637 fewer individual aged 75-79 deaths from Unknown Causes is arrived at.
Yearly Unknown Causes Tally: 29,418 / 40,867
The next 3,303 of the 40,867 individual deaths from Unknown Causes in 2022 were among elderly men and women aged 80-84, accounting for 8.52% of the 38,782 total deaths in this group.
This is down 2% compared to Old Normal rates. Those rates, applied to this year's population of 714,480 elderly men and women aged 80-84, would have predicted 3,355 deaths from Unknown Causes this year.
This means there were 52 fewer deaths than expected from Unknown Causes among elderly men and women aged 80-84 living in California in 2022.
Overall, 24,047 deaths from Unknown Causes represent 1,068 lives saved among elderly men and women aged 80-84 over the first 8 years of California's New Normal™.
Click the bar graph above to see how the both the 2022 total of 52 fewer and the 8 year total of 24,047 fewer individual aged 80-84 deaths from Unknown Causes is arrived at.
Yearly Unknown Causes Tally: 32,721 / 40,867
The next 11,449 of the 40,867 deaths from Unknown Causes in 2022 were among elderly men and women aged 80+, accounting for 8.29% of the 138,098 total deaths in this group.
This is up 6% compared to Old Normal rates which, when applied to this year's population of 714,480 would have predicted 10,775 deaths from Unknown Causes this year.
This means there were 674 more deaths than expected from Unknown Causes among elderly men and women aged 80+ living in California in 2022.
Overall, 84,779 deaths from Unknown Causes represent 4,110 lives lost among elderly men and women aged 80+ over the first 8 years of California's New Normal™.
Click the bar graph above to see how the 8 year total of 84,779 excess individual deaths from Unknown Causes is arrived at.
Yearly Unknown Causes Tally: 44,170 / 40,867*
* California does not report the deaths of 3,303 babies in it's death totals
×