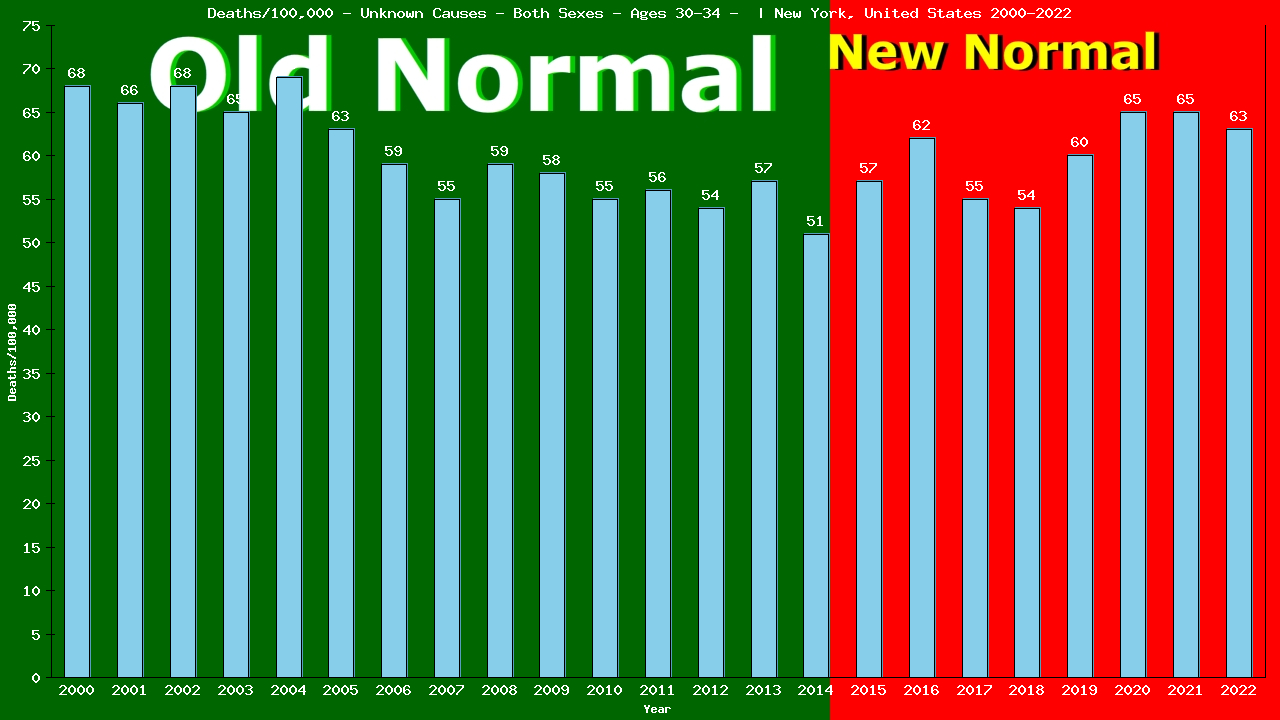
2022 vs New Normal™ for people aged 30-34 in New York
894 of 1,933 total deaths were from Unknown Causes
46.25% of all deaths were from Unknown Causes
This is up 2% compared to Old Normal rates.
859 of 1,240 total deaths would have been expected under Old Normal conditions.
35 more deaths from Unknown Causes in 2022.
693 more All Cause deaths in 2022.
43 fewer deaths from Unknown Causes (2015-2022)
3,345 more All Cause deaths over the first 8 years of New York’s New Normal™.
To show this year’s deaths from Unknown Causes are up 2% compared to Old Normal rates, we need to calculate the rates for both 2022 and for the Old Normal.
Remember, death rates are calculated to answer these questions:
“How many people aged 30-34 were there?” and
“How many of them died from Unknown Causes?”
The following 2 charts provide this information:
Deaths – Unknown Causes – Male – Aged 30-34 | New York, United-states
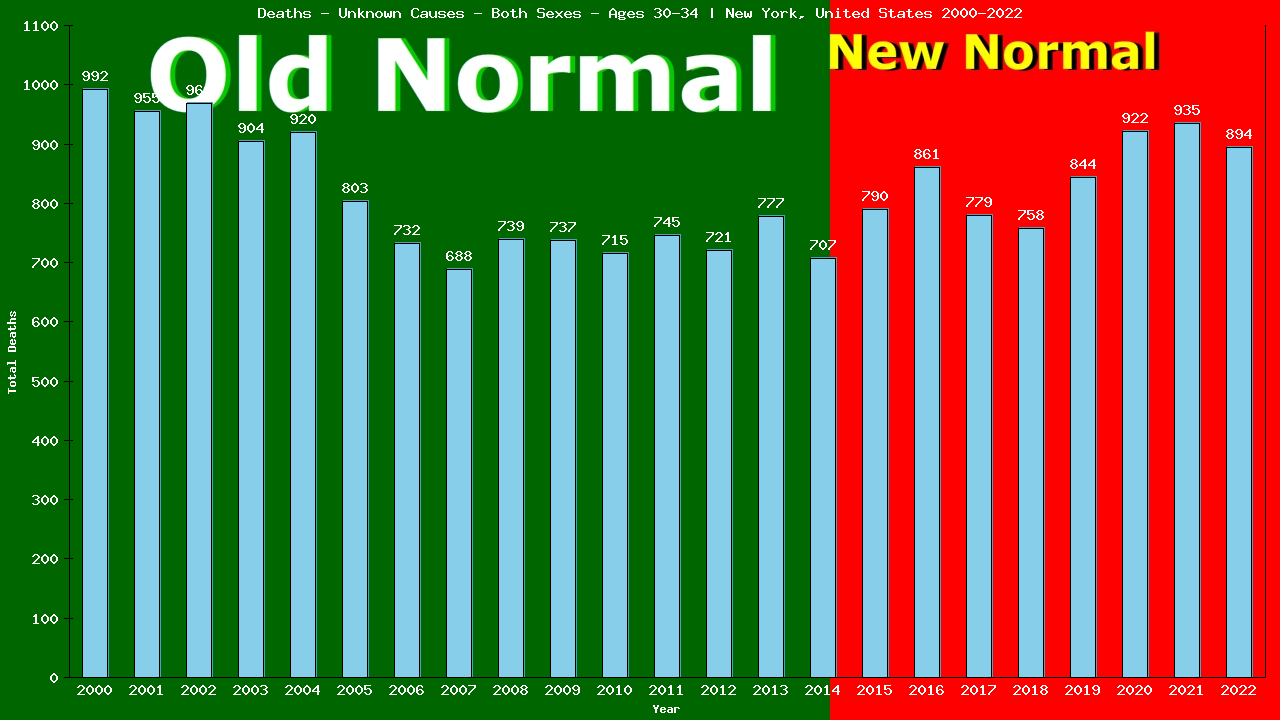
Population – Male – Aged 30-34 – [2000-2022] | New York, United-states
From the charts, we can see that in 2022, 894 of 1,412,771 people aged 30-34 living in New York died from Unknown Causes.
894 ÷ 1,412,771 = 0.00063 (2022 CDR)
We’ll use the table below to calculate our Old Normal rate for deaths from Unknown Causes
Old Normal (2001-2014) New York male aged 30-34 Unknown Causes
Year
Pop
Died
From
|2000
1,452,599
1,445
992
|2001
1,439,209
1,716
955
|2002
1,413,944
1,310
969
|2003
1,377,591
1,218
904
|2004
1,330,171
1,139
920
|Year
Pop
Died
From
|2005
1,274,472
1,045
803
|2006
1,234,210
1,028
732
|2007
1,229,096
1,001
688
|2008
1,240,874
1,028
739
|2009
1,262,714
1,000
737
|Year
Pop
Died
From
|2010
1,279,160
987
715
|2011
1,310,261
1,118
745
|2012
1,332,980
1,122
721
|2013
1,357,550
1,138
777
|2014
1,374,027
1,186
707
Cumulative:
Population
Deaths
Unknown Causes
Totals:
19,908,858
17,481
12,104
The table shows there were a total of 12,104 deaths from Unknown Causes among 19,908,858 people aged 30-34 living in New York in the 15 years immediately prior to the New Normal™.
12,104 ÷ 19,908,858 = 0.00061 (Old Normal CDR)
We can use the Old Normal rate to predict this year’s deaths:
2022 pop X Old Normal CDR = expected deaths
1,412,771 X 0.00061 = 859 expected deaths
The difference between actual and expected deaths shows lives saved or lost:
894 – 859 = 35
Dividing the actual deaths by the expected deaths gives us the comparative rates:
894 ÷ 859 = 1.0240
This reveals 35 lives lost and is 102.40% of what we expected (an increase of 2%) in deaths from Unknown Causes among people aged 30-34 living in New York in 2022, as compared to the Old Normal.
5yr CDR (2017-2021)
Year
Pop
Died
From
|2017
1,410,936
1,458
779
|2018
1,393,216
1,391
758
|2019
1,402,648
1,497
844
|2020
1,409,561
2,041
922
|2021
1,428,548
2,054
935
Total:
9,814,243
11,270
5,889
This is the same method used by Public Health to calculate the 5-yr CDR (Cumulative Death Rate):
5,889 ÷ 9,814,243 = 0.00060 (5-yr CDR)
1,412,771(2022 pop) X 0.00060 = 848 expected deaths
The difference between actual and expected deaths:
894 – 848 = 46 or 46 lives lost
Divide actual deaths by expected deaths:
894 ÷ 848 = 1.0373 or an increase of 4%
for deaths from Unknown Causes among people aged 30-34 living in New York in 2022, as compared to the previous 5 years.
Compare our Old Normal to the 5yr CDR. Does it tell the same story your TV does?
Finally, the same method can also be used to compare our Old Normal rate to the New Normal™ rate:
New Normal™ population X Old Normal rate = expected deaths
11,227,014 X 0.00061 = 6,826 expected deaths
The difference between actual and expected deaths:
6783 – 6,826 = -43 or 43 lives saved
Dividing the actual deaths by the expected deaths:
6,783 ÷ 6,826 = 0.9777 or a decrease of 2%
in deaths from Unknown Causes among people aged 30-34 living in New York in the New Normal™, as compared to the Old Normal.
New Normal (2015-2022)
Year
Pop
Died
From
|2015
1,382,256
1,289
790
|2016
1,387,078
1,540
861
|2017
1,410,936
1,458
779
|2018
1,393,216
1,391
758
|2019
1,402,648
1,497
844
|2020
1,409,561
2,041
922
|2021
1,428,548
2,054
935
|2022
1,412,771
1,933
894
Total:
11,227,014
13,203
6,783
The world has been led to believe that a deadly pandemic swept the globe beginning in 2020, causing an increase in death rates, especially among the elderly
The data show that death rates began to increase in 2015, immediately upon implementation of the UN’s 2030 Agenda for Sustainable Development, that young adults have experienced ever-increasing death rates since, and that death rates among the elderly have remained relatively stable.
Browse through the age-categorized charts below to see the evidence of this. Click on any chart to see the full analysis for each age group.
Deaths/100,000 male 30-34 from Unknown Causes
31,047 of the 173,938 deaths among individuals of all ages living in New York in 2022 were from Unknown Causes (17.85% of all deaths).
This is up 17% compared to Old Normal (2000-2014) rates which, when applied to the this year's both sexes population of 19,219,967 individuals would have predicted 26,259 deaths from Unknown Causes.
This means there were 4,788 more deaths than expected from Unknown Causes among individuals of all ages living in New York in 2022.
To date, 19,944 individual lives have been lost to Unknown Causes over the first 8 years of New York's New Normal™.
Browse through the age categories below to learn how these deaths from Unknown Causes in 2022 are distributed among each age group of individuals in New York.
Click the bar graph above to see how both the 2022 loss of 4,788 lives and the 8-year loss of 19,944 individual lives from Unknown Causes is arrived at.
The first 605 of the 31,047 deaths from Unknown Causes in 2022 were among babies in their first year of life, accounting for 68.44% of the 884 total deaths in this group.
This is down 8% compared to Old Normal rates which, when applied to this year's population of 214,746 babies in their first year of life, would have predicted 656 deaths from Unknown Causes this year.
This means there were 51 fewer deaths than expected from Unknown Causes among babies in their first year of life living in New York in 2022.
Overall, 4,880 deaths from Unknown Causes represent 637 lives saved among babies in their first year of life over the first 8 years of New York's New Normal™.
Click the bar graph above to see how both the 2022 total of 51 fewer live lost than expected and the 8 year total of 4880 lives saved from Unknown Causes among babies in their first year of life is arrived at.
Yearly Unknown Causes Tally: 605 / 31,047
The next 169 of the 31,047 individual deaths from Unknown Causes in 2022 were among pre-schoolers aged 1-4, accounting for 99.99% of the 169 total deaths in this group.
This is down 16% compared to Old Normal rates. Those rates, applied to this year's population of 844,471 pre-schoolers aged 1-4, would have predicted 193 deaths from Unknown Causes this year.
This means there were 24 fewer deaths than expected from Unknown Causes among pre-schoolers aged 1-4 living in New York in 2022.
Overall, 1,269 deaths from Unknown Causes represent 381 lives saved among pre-schoolers aged 1-4 over the first 8 years of New York's New Normal™.
Click the bar graph above to see how the both the 2022 total of 24 fewer and the 8 year total of 1,269 fewer individual aged 1-4 deaths from Unknown Causes is arrived at.
Yearly Unknown Causes Tally: 774 / 31,047
The next 126 of the 31,047 individual deaths from Unknown Causes in 2022 were among children aged 5-9, accounting for 99.99% of the 126 total deaths in this group.
This is down 9% compared to Old Normal rates. Those rates, applied to this year's population of 1,105,584 children aged 5-9, would have predicted 127 deaths from Unknown Causes this year.
This means there were 1 fewer deaths than expected from Unknown Causes among children aged 5-9 living in New York in 2022.
Overall, 913 deaths from Unknown Causes represent 126 lives saved among children aged 5-9 over the first 8 years of New York's New Normal™.
Click the bar graph above to see how the both the 2022 total of 1 fewer and the 8 year total of 913 fewer individual aged 5-9 deaths from Unknown Causes is arrived at.
Yearly Unknown Causes Tally: 900 / 31,047
The next 165 of the 31,047 individual deaths from Unknown Causes in 2022 were among children aged 10-14, accounting for 99.99% of the 165 total deaths in this group.
This is up 2% compared to Old Normal rates. Those rates, applied to this year's population of 1,128,498 children aged 10-14, would have predicted 150 deaths from Unknown Causes this year.
This means there were 15 more deaths than expected from Unknown Causes among children aged 10-14 living in New York in 2022.
Overall, 1,092 deaths from Unknown Causes represent 112 lives saved among children aged 10-14 over the first 8 years of New York's New Normal™.
Click the bar graph above to see how the both the 2022 total of 15 more and the 8 year total of 1,092 more individual aged 10-14 deaths from Unknown Causes is arrived at.
Yearly Unknown Causes Tally: 1,065 / 31,047
The next 256 of the 31,047 individual deaths from Unknown Causes in 2022 were among teens aged 15-19, accounting for 62.90% of the 407 total deaths in this group.
This is down 27% compared to Old Normal rates. Those rates, applied to this year's population of 1,194,568 teens aged 15-19, would have predicted 340 deaths from Unknown Causes this year.
This means there were 84 fewer deaths than expected from Unknown Causes among teens aged 15-19 living in New York in 2022.
Overall, 2,177 deaths from Unknown Causes represent 566 lives saved among teens aged 15-19 over the first 8 years of New York's New Normal™.
Click the bar graph above to see how the both the 2022 total of 84 fewer and the 8 year total of 2,177 fewer individual aged 15-19 deaths from Unknown Causes is arrived at.
Yearly Unknown Causes Tally: 1,321 / 31,047
The next 447 of the 31,047 individual deaths from Unknown Causes in 2022 were among people aged 20-24, accounting for 51.03% of the 876 total deaths in this group.
This is down 19% compared to Old Normal rates. Those rates, applied to this year's population of 1,304,457 people aged 20-24, would have predicted 541 deaths from Unknown Causes this year.
This means there were 94 fewer deaths than expected from Unknown Causes among people aged 20-24 living in New York in 2022.
Overall, 3,737 deaths from Unknown Causes represent 637 lives saved among people aged 20-24 over the first 8 years of New York's New Normal™.
Click the bar graph above to see how the both the 2022 total of 94 fewer and the 8 year total of 3,737 fewer individual aged 20-24 deaths from Unknown Causes is arrived at.
Yearly Unknown Causes Tally: 1,768 / 31,047
The next 693 of the 31,047 individual deaths from Unknown Causes in 2022 were among people aged 25-29, accounting for 50.44% of the 1,374 total deaths in this group.
This is up 3% compared to Old Normal rates. Those rates, applied to this year's population of 1,354,760 people aged 25-29, would have predicted 660 deaths from Unknown Causes this year.
This means there were 33 more deaths than expected from Unknown Causes among people aged 25-29 living in New York in 2022.
Overall, 5,413 deaths from Unknown Causes represent 261 lives saved among people aged 25-29 over the first 8 years of New York's New Normal™.
Click the bar graph above to see how the both the 2022 total of 33 more and the 8 year total of 5,413 more individual aged 25-29 deaths from Unknown Causes is arrived at.
Yearly Unknown Causes Tally: 2,461 / 31,047
The next 894 of the 31,047 individual deaths from Unknown Causes in 2022 were among people aged 30-34, accounting for 46.25% of the 1,933 total deaths in this group.
This is up 2% compared to Old Normal rates. Those rates, applied to this year's population of 1,412,771 people aged 30-34, would have predicted 859 deaths from Unknown Causes this year.
This means there were 35 more deaths than expected from Unknown Causes among people aged 30-34 living in New York in 2022.
Overall, 6,783 deaths from Unknown Causes represent 43 lives saved among people aged 30-34 over the first 8 years of New York's New Normal™.
Click the bar graph above to see how the both the 2022 total of 35 more and the 8 year total of 6,783 more individual aged 30-34 deaths from Unknown Causes is arrived at.
Yearly Unknown Causes Tally: 3,355 / 31,047
The next 1,142 of the 31,047 individual deaths from Unknown Causes in 2022 were among people aged 35-39, accounting for 47.78% of the 2,390 total deaths in this group.
This is up 12% compared to Old Normal rates. Those rates, applied to this year's population of 1,309,358 people aged 35-39, would have predicted 1,011 deaths from Unknown Causes this year.
This means there were 131 more deaths than expected from Unknown Causes among people aged 35-39 living in New York in 2022.
Overall, 7,961 deaths from Unknown Causes represent 35 lives lost among people aged 35-39 over the first 8 years of New York's New Normal™.
Click the bar graph above to see how the both the 2022 total of 131 more and the 8 year total of 7,961 more individual aged 35-39 deaths from Unknown Causes is arrived at.
Yearly Unknown Causes Tally: 4,497 / 31,047
The next 1,169 of the 31,047 individual deaths from Unknown Causes in 2022 were among people aged 40-44, accounting for 40.77% of the 2,867 total deaths in this group.
This is up 2% compared to Old Normal rates. Those rates, applied to this year's population of 1,224,012 people aged 40-44, would have predicted 1,137 deaths from Unknown Causes this year.
This means there were 32 more deaths than expected from Unknown Causes among people aged 40-44 living in New York in 2022.
Overall, 8,926 deaths from Unknown Causes represent 70 lives lost among people aged 40-44 over the first 8 years of New York's New Normal™.
Click the bar graph above to see how the both the 2022 total of 32 more and the 8 year total of 8,926 more individual aged 40-44 deaths from Unknown Causes is arrived at.
Yearly Unknown Causes Tally: 5,666 / 31,047
The next 1,367 of the 31,047 individual deaths from Unknown Causes in 2022 were among people aged 45-49, accounting for 39.70% of the 3,443 total deaths in this group.
This is up 7% compared to Old Normal rates. Those rates, applied to this year's population of 1,141,785 people aged 45-49, would have predicted 1,265 deaths from Unknown Causes this year.
This means there were 102 more deaths than expected from Unknown Causes among people aged 45-49 living in New York in 2022.
Overall, 11,151 deaths from Unknown Causes represent 249 lives lost among people aged 45-49 over the first 8 years of New York's New Normal™.
Click the bar graph above to see how the both the 2022 total of 102 more and the 8 year total of 11,151 more individual aged 45-49 deaths from Unknown Causes is arrived at.
Yearly Unknown Causes Tally: 7,033 / 31,047
The next 1,711 of the 31,047 individual deaths from Unknown Causes in 2022 were among people aged 50-54, accounting for 31.60% of the 5,415 total deaths in this group.
This is up 6% compared to Old Normal rates. Those rates, applied to this year's population of 1,258,606 people aged 50-54, would have predicted 1,598 deaths from Unknown Causes this year.
This means there were 113 more deaths than expected from Unknown Causes among people aged 50-54 living in New York in 2022.
Overall, 14,099 deaths from Unknown Causes represent 672 lives lost among people aged 50-54 over the first 8 years of New York's New Normal™.
Click the bar graph above to see how the both the 2022 total of 113 more and the 8 year total of 14,099 more individual aged 50-54 deaths from Unknown Causes is arrived at.
Yearly Unknown Causes Tally: 8,744 / 31,047
The next 2,131 of the 31,047 individual deaths from Unknown Causes in 2022 were among people aged 55-59, accounting for 25.01% of the 8,520 total deaths in this group.
This is up 4% compared to Old Normal rates. Those rates, applied to this year's population of 1,319,494 people aged 55-59, would have predicted 2,036 deaths from Unknown Causes this year.
This means there were 95 more deaths than expected from Unknown Causes among people aged 55-59 living in New York in 2022.
Overall, 16,710 deaths from Unknown Causes represent 22 lives saved among people aged 55-59 over the first 8 years of New York's New Normal™.
Click the bar graph above to see how the both the 2022 total of 95 more and the 8 year total of 16,710 more individual aged 55-59 deaths from Unknown Causes is arrived at.
Yearly Unknown Causes Tally: 10,875 / 31,047
The next 2,559 of the 31,047 individual deaths from Unknown Causes in 2022 were among people aged 60-64, accounting for 20.57% of the 12,440 total deaths in this group.
This is up 0% compared to Old Normal rates. Those rates, applied to this year's population of 1,300,465 people aged 60-64, would have predicted 2,540 deaths from Unknown Causes this year.
This means there were 19 more deaths than expected from Unknown Causes among people aged 60-64 living in New York in 2022.
Overall, 18,149 deaths from Unknown Causes represent 1,291 lives saved among people aged 60-64 over the first 8 years of New York's New Normal™.
Click the bar graph above to see how the both the 2022 total of 19 more and the 8 year total of 18,149 more individual aged 60-64 deaths from Unknown Causes is arrived at.
Yearly Unknown Causes Tally: 13,434 / 31,047
The next 2,678 of the 31,047 individual deaths from Unknown Causes in 2022 were among elderly men and women aged 65-69, accounting for 17.83% of the 15,019 total deaths in this group.
This is down 3% compared to Old Normal rates. Those rates, applied to this year's population of 1,120,311 elderly men and women aged 65-69, would have predicted 2,761 deaths from Unknown Causes this year.
This means there were 83 fewer deaths than expected from Unknown Causes among elderly men and women aged 65-69 living in New York in 2022.
Overall, 18,681 deaths from Unknown Causes represent 1,853 lives saved among elderly men and women aged 65-69 over the first 8 years of New York's New Normal™.
Click the bar graph above to see how the both the 2022 total of 83 fewer and the 8 year total of 18,681 fewer individual aged 65-69 deaths from Unknown Causes is arrived at.
Yearly Unknown Causes Tally: 16,112 / 31,047
The next 2,743 of the 31,047 individual deaths from Unknown Causes in 2022 were among elderly men and women aged 70-74, accounting for 15.43% of the 17,776 total deaths in this group.
This is down 4% compared to Old Normal rates. Those rates, applied to this year's population of 908,521 elderly men and women aged 70-74, would have predicted 2,852 deaths from Unknown Causes this year.
This means there were 109 fewer deaths than expected from Unknown Causes among elderly men and women aged 70-74 living in New York in 2022.
Overall, 18,973 deaths from Unknown Causes represent 1,355 lives saved among elderly men and women aged 70-74 over the first 8 years of New York's New Normal™.
Click the bar graph above to see how the both the 2022 total of 109 fewer and the 8 year total of 18,973 fewer individual aged 70-74 deaths from Unknown Causes is arrived at.
Yearly Unknown Causes Tally: 18,855 / 31,047
The next 2,708 of the 31,047 individual deaths from Unknown Causes in 2022 were among elderly men and women aged 75-79, accounting for 13.21% of the 20,498 total deaths in this group.
This is down 1% compared to Old Normal rates. Those rates, applied to this year's population of 655,902 elderly men and women aged 75-79, would have predicted 2,723 deaths from Unknown Causes this year.
This means there were 15 fewer deaths than expected from Unknown Causes among elderly men and women aged 75-79 living in New York in 2022.
Overall, 19,073 deaths from Unknown Causes represent 221 lives lost among elderly men and women aged 75-79 over the first 8 years of New York's New Normal™.
Click the bar graph above to see how the both the 2022 total of 15 fewer and the 8 year total of 19,073 fewer individual aged 75-79 deaths from Unknown Causes is arrived at.
Yearly Unknown Causes Tally: 21,563 / 31,047
The next 2,706 of the 31,047 individual deaths from Unknown Causes in 2022 were among elderly men and women aged 80-84, accounting for 12.23% of the 22,129 total deaths in this group.
This is up 14% compared to Old Normal rates. Those rates, applied to this year's population of 421,658 elderly men and women aged 80-84, would have predicted 2,371 deaths from Unknown Causes this year.
This means there were 335 more deaths than expected from Unknown Causes among elderly men and women aged 80-84 living in New York in 2022.
Overall, 19,267 deaths from Unknown Causes represent 1,602 lives lost among elderly men and women aged 80-84 over the first 8 years of New York's New Normal™.
Click the bar graph above to see how the both the 2022 total of 335 more and the 8 year total of 19,267 more individual aged 80-84 deaths from Unknown Causes is arrived at.
Yearly Unknown Causes Tally: 24,269 / 31,047
The next 9,484 of the 31,047 deaths from Unknown Causes in 2022 were among elderly men and women aged 80+, accounting for 11.91% of the 79,636 total deaths in this group.
This is up 21% compared to Old Normal rates which, when applied to this year's population of 421,658 would have predicted 7,830 deaths from Unknown Causes this year.
This means there were 1,654 more deaths than expected from Unknown Causes among elderly men and women aged 80+ living in New York in 2022.
Overall, 69,872 deaths from Unknown Causes represent 11,538 lives lost among elderly men and women aged 80+ over the first 8 years of New York's New Normal™.
Click the bar graph above to see how the 8 year total of 69,872 excess individual deaths from Unknown Causes is arrived at.
Yearly Unknown Causes Tally: 33,753 / 31,047*
* New York does not report the deaths of 2,706 babies in it's death totals